Using Xcode Instruments for C++ CPU profiling
TL;DR: This article is an overview of how to use Xcode Instruments along its
xctracecommand-line tool companion to perform CPU profiling of C++ programs
CPU profiling is a technique to sample and analyze the processor time consumed by a program to help identify where CPU-bound performance problems are. If you are a macOS user working with C++, the best tool out there for CPU profiling is Instruments.
Instruments is a profiling application made by Apple. Instruments supports complex profiling scenarios involving more than just CPU. For example, you can profile memory, file-system, and battery utilization, and even the combination of those to spot higher level patterns.
In this article, we will focus on one of the most common C++ CPU profiling scenarios: reproducible short lived programs written using Google Benchmark. The goal is to provide a relatively high-level introduction to CPU profiling on macOS rather than exhaustively exploring every feature of Instruments.
This article is based on Xcode 15.1 (15C65) running on macOS Sonoma 14.2.1 on a 2020 M1 MacBook Pro.
An brief introduction to Instruments
Instruments is a free standalone performance analysis application distributed as part of Xcode. It is built on top of the well known DTrace tool originally developed for the Solaris operating system.
While we won’t cover it on this post, DTrace is directly available on every macOS installation. If you want to learn how to develop your own tracing scripts beyond what Instruments is capable of, I recommend reading the book DTrace: Dynamic Tracing in Oracle Solaris, Mac OS X and FreeBSD and consulting my own DTrace notes.
While the main use case of Instruments is analyzing Objective-C and Swift applications, it is equally useful for exploring general purpose C++ programs.
Launching Instruments
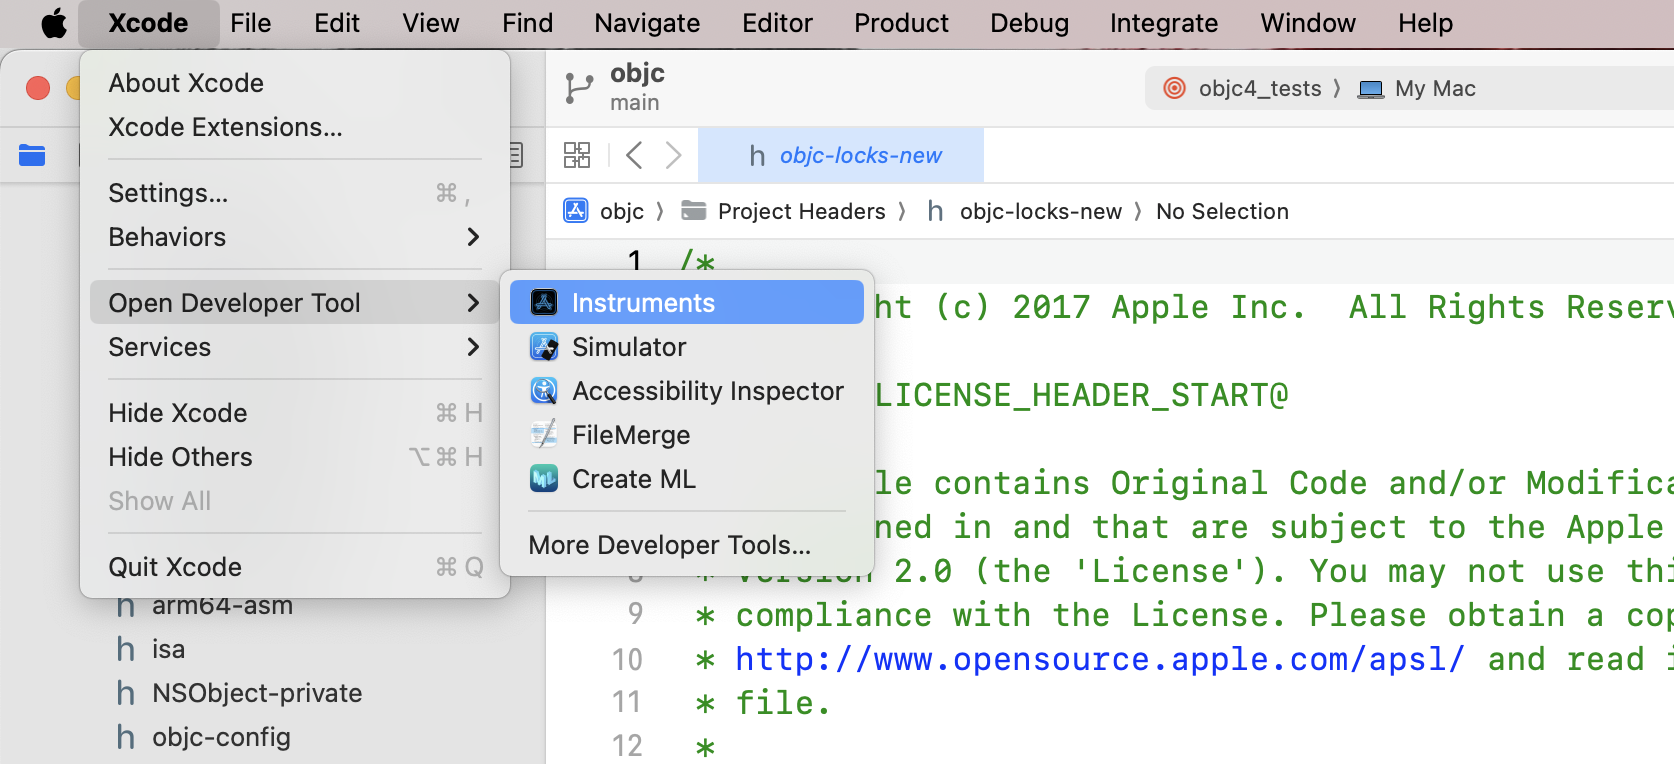
If you are using the Xcode IDE, you can conveniently open the
Instruments application from the menu bar at
Xcode -> Open Developer Tool -> Instruments:
However, Instruments is a standalone application. Unless you use Xcode as your main code editor, you might find it convenient to add the Instruments application directly to your dock.
If you are curious, the Instruments application bundle is located at:
$(dirname $(xcode-select --print-path))/Applications/Instruments.appUnder a default Xcode installation, that path expands to:
/Applications/Xcode.app/Contents/Applications/Instruments.appA simple CPU profile example
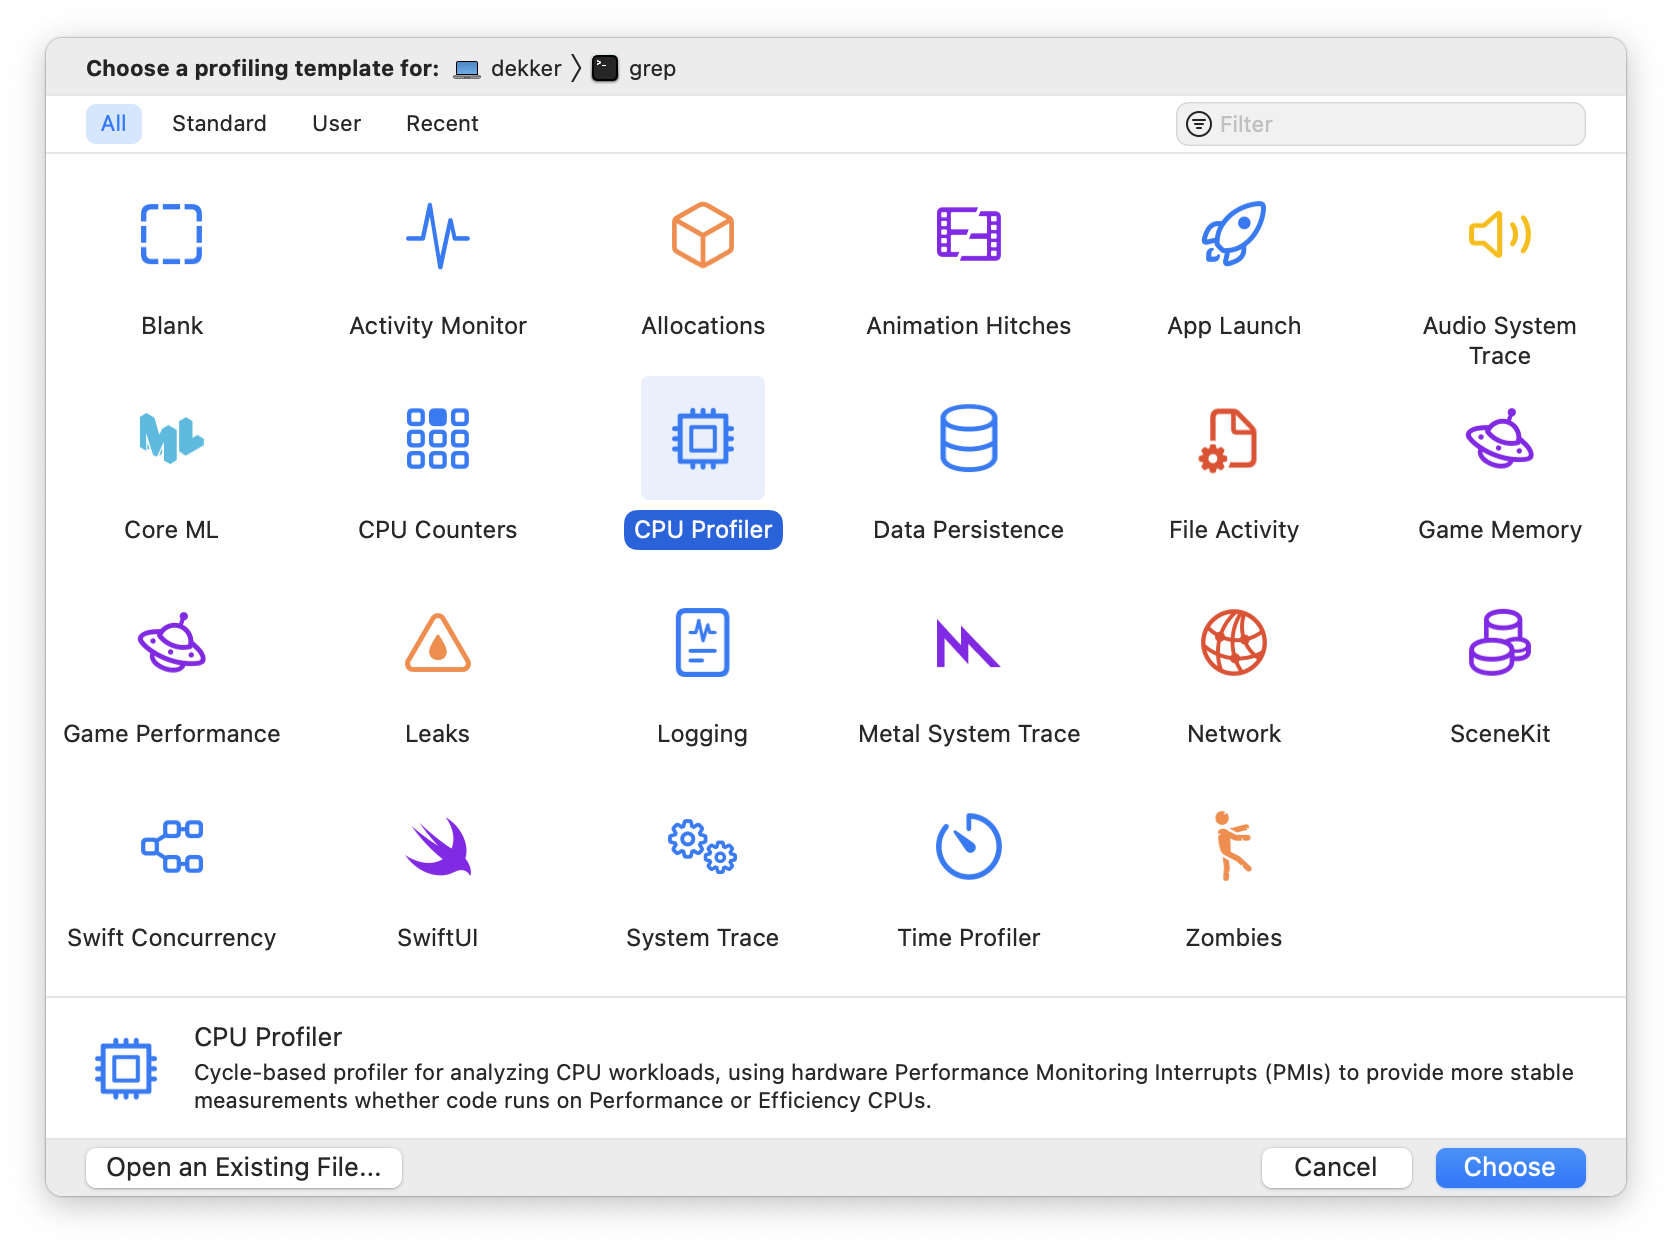
After opening it, the Instruments application will greet you with a wizard to select the application you want to profile (at the top of the window) and the profiling templates you want to use (at the center of the window):
For fun, let’s profile the grep(1) utility while
searching for occurrences of Brendan Gregg (promoter of
DTrace and author of the book recommended before) across the
macOS SDK.
To do this, first click on the CPU Profiler
template. Then, click on the top of the window and on Choose
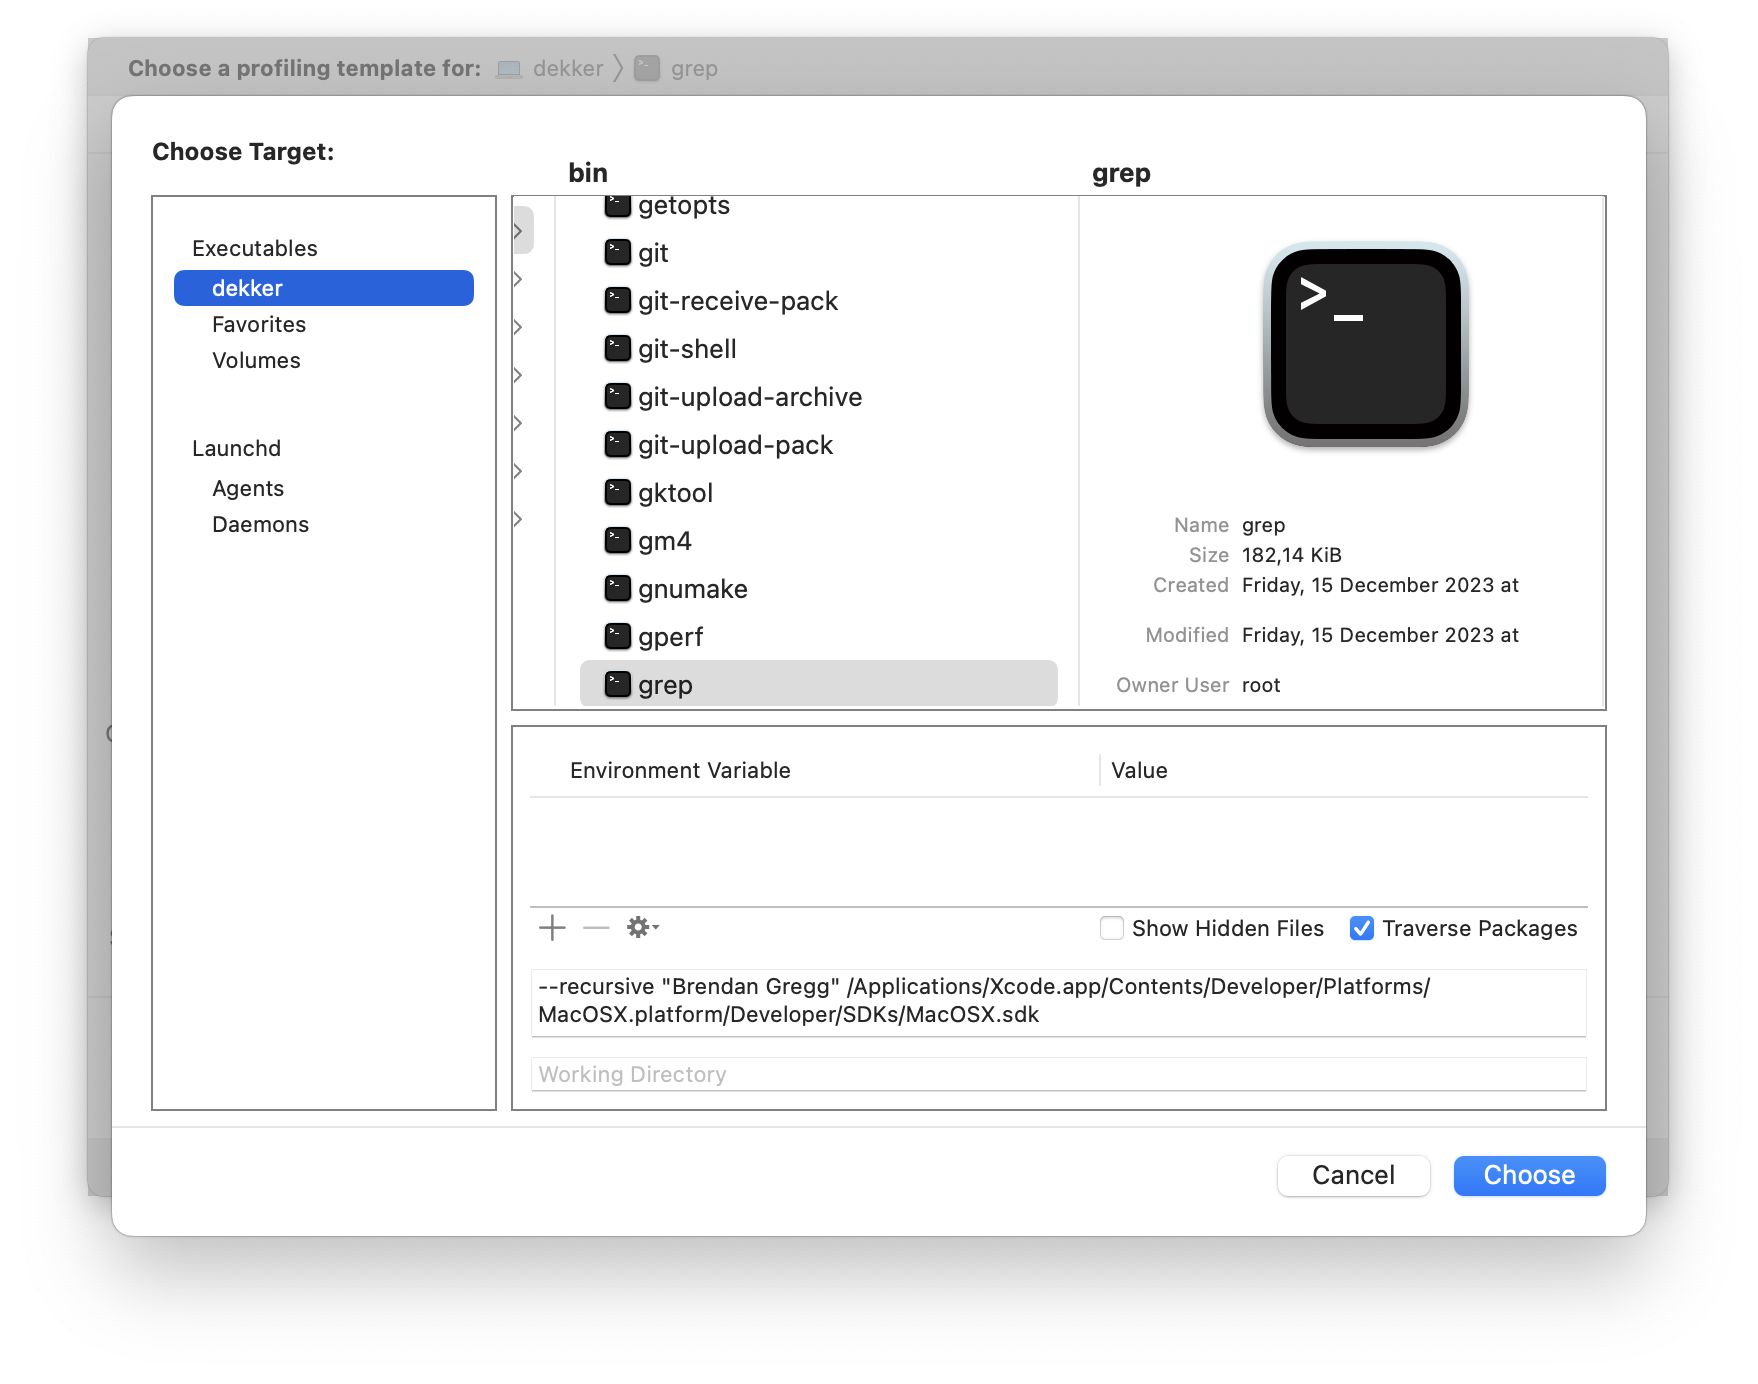
Target… to select the target to profile. Once on the target
selection modal, navigate to /usr/bin/grep to
select it as the target executable. Then, assuming you have a
default Xcode installation at
/Applications/Xcode.app, copy these command
arguments to the bottom of the screen:
--recursive "Brendan Gregg" /Applications/Xcode.app/Platforms/MacOSX.platform/Developer/SDKs/MacOSX.sdkBefore accepting it, the target selection modal should look like this:
After clicking Choose, you will be presented with a
blank Instruments window. Once you click the red record button
in the left of the toolbar, grep(1) will run for a
few seconds with the command line arguments we set in the target
selection modal, and you will be presented with the CPU
profiling results:
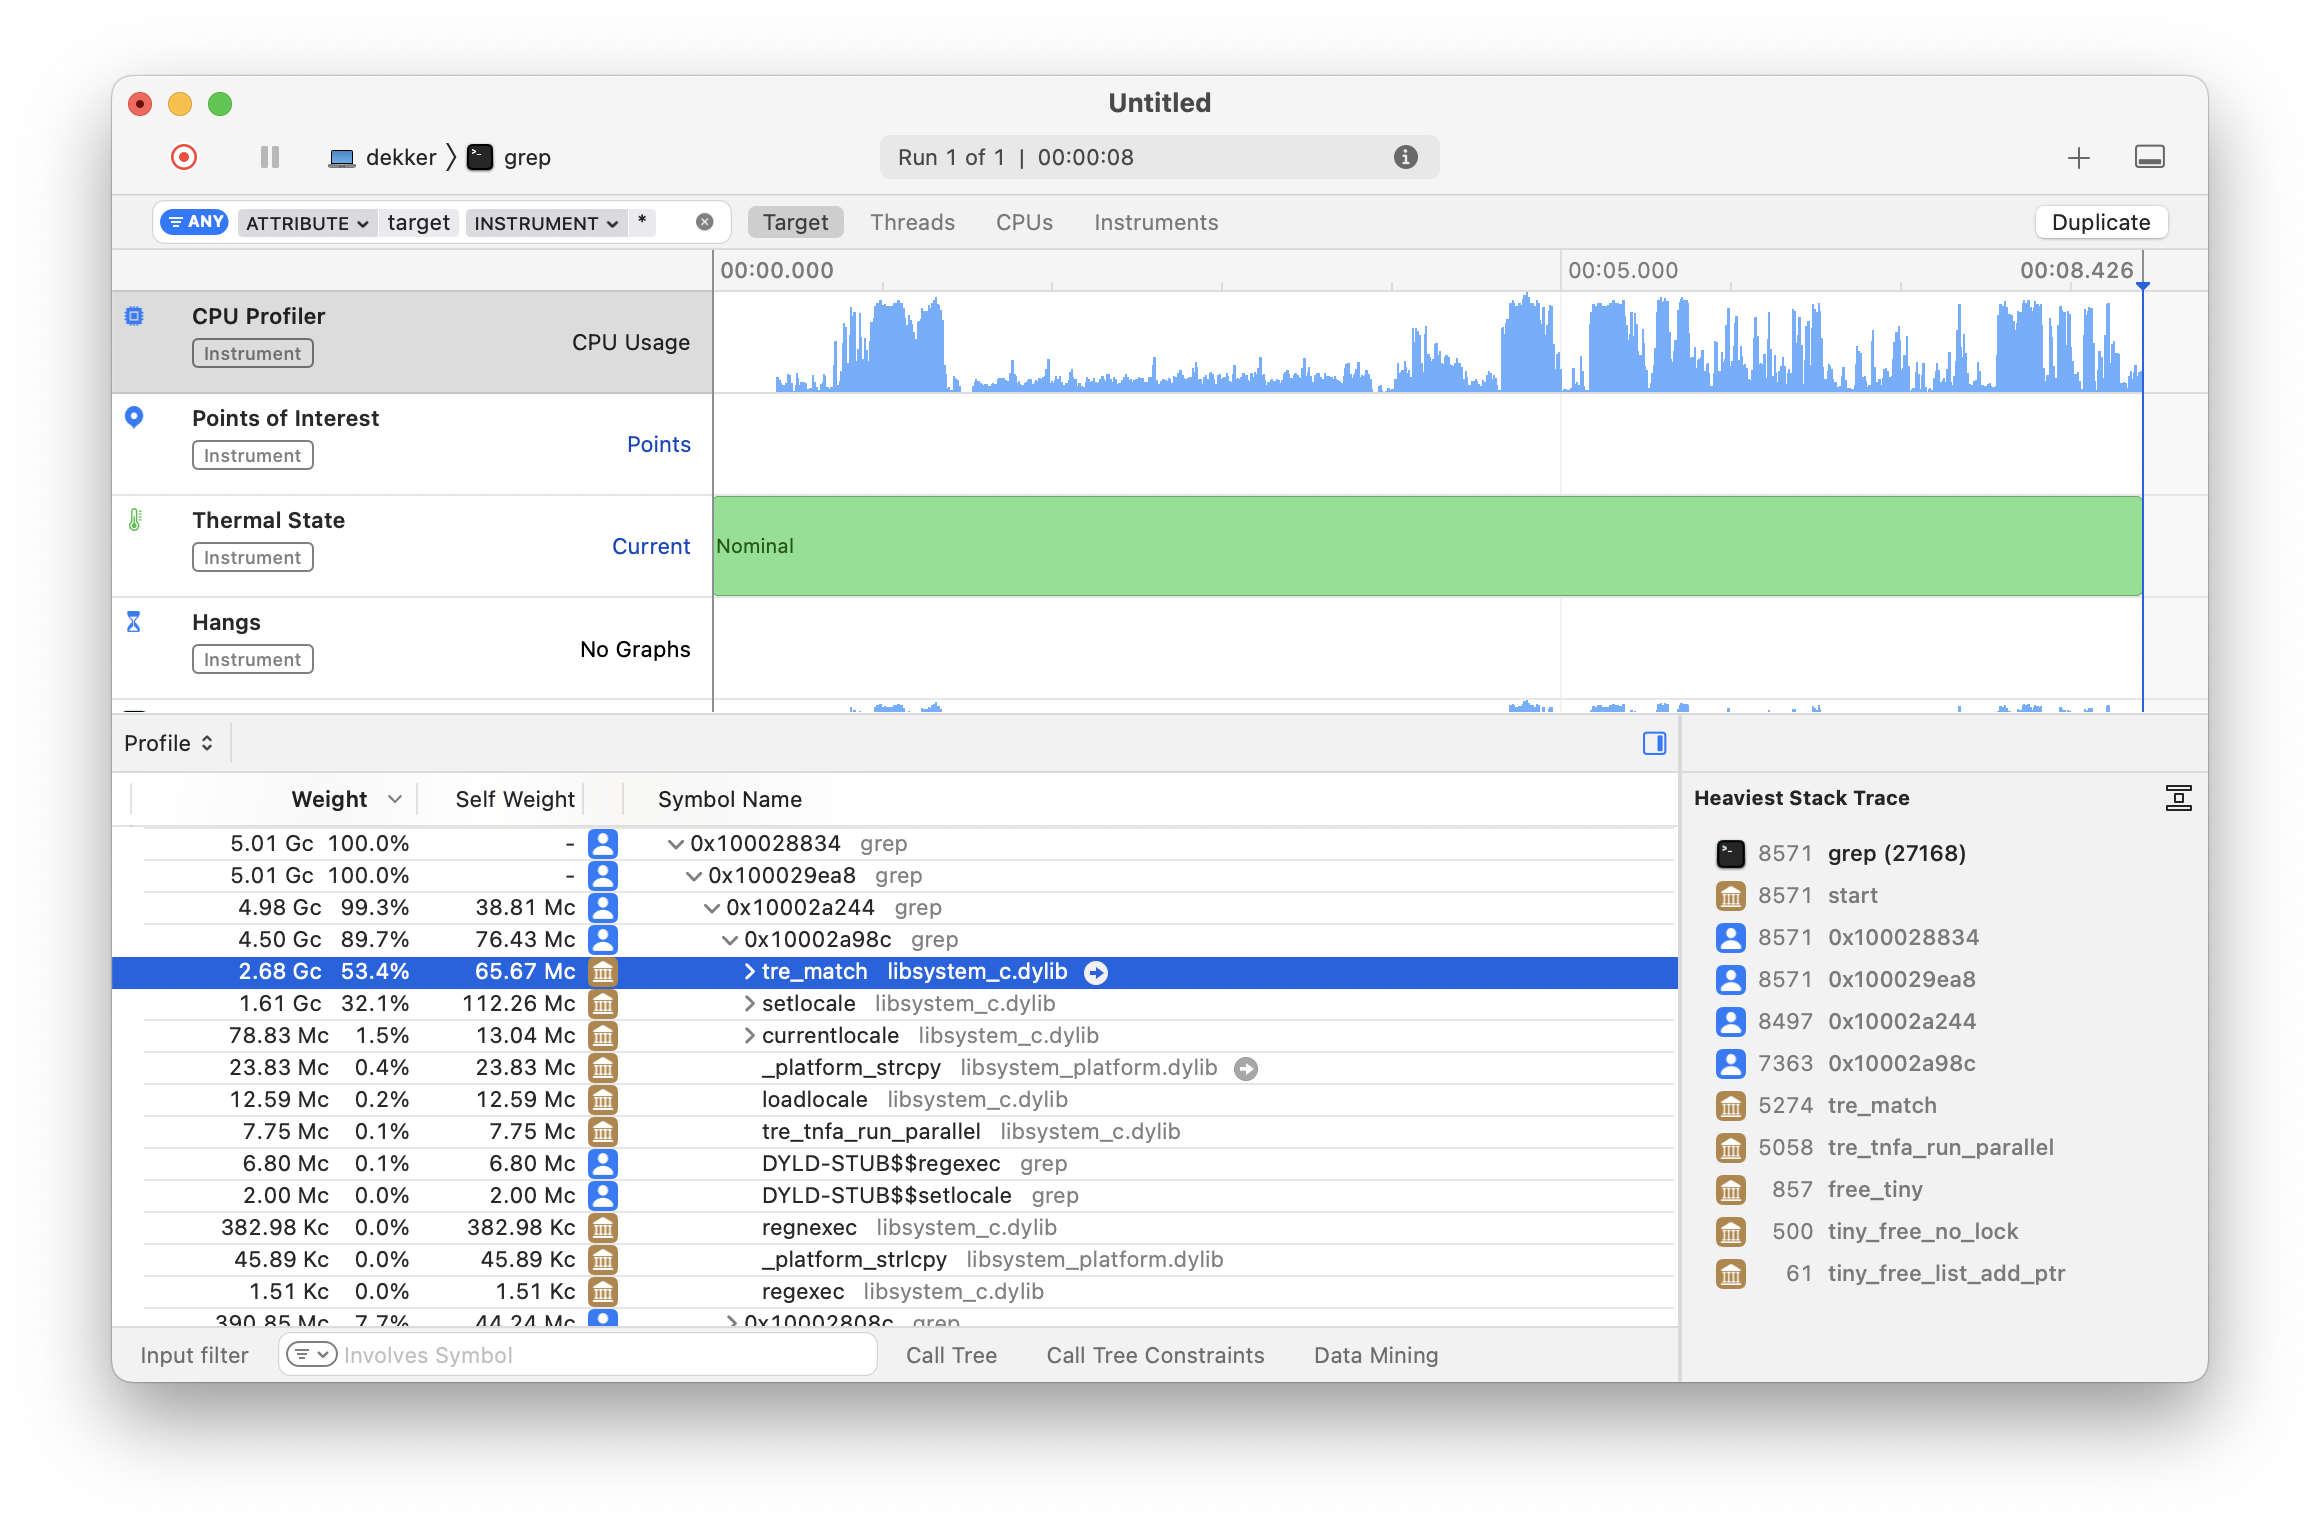
As we can see in the detail pane, grep(1) is
spending a significant amount of CPU time on the
tre_match function for regular expression matching.
This function comes from the TRE
open-source regex matching library that Apple includes as part
of libc
(and ships as part of libSystem).
After seeing that most of the time is spent on regular expression matching, I tried to use
fgrep(1), which supposedly only handles fixed text patterns. However, turns out thatfgrep(1)still executestre_match.
Profiling from the command-line
Opening the Instruments graphical application and visually configuring the profiling target and templates every time is quite cumbersome. Before getting deeper, let’s improve our workflow.
Xcode ships with xctrace, a command-line
interface to Instruments that we briefly touched on in a previous
article. With it, we can conveniently perform CPU profiles
on arbitrary programs from the terminal. For example, we can
re-record the grep(1) CPU profile from the previous
section as follows:
xcrun xctrace record \
  --template 'CPU Profiler' \
  --no-prompt \
  --output example.trace \
  --target-stdout - \
  --launch -- /usr/bin/grep --recursive "Brendan Gregg" \
  "$(xcode-select --print-path)/Platforms/MacOSX.platform/Developer/SDKs/MacOSX.sdk"
This command will record (the record command) a
CPU profile (as set by --template) of
/usr/bin/grep with the same command-line arguments
as before (as set by --launch) that redirects the
target process standard output to the terminal (as set by
--target-stdout) and stores the results in a file
called example.trace (as set by
--output). Once the recording completes, you can
open the profiling results on the Instruments graphical
application using the open(1) command:
open example.traceConvenient script to profile faster
To make my life even easier, I have a little POSIX shell
script called cpu_profile that performs a CPU
Profile and opens the resulting trace on Instruments (feel free
to steal it!):
#!/bin/sh

set -o errexit
set -o nounset

if [ "$#" -lt 1 ]
then
  echo "Usage $0 <program> [arguments...]" 1>&2
  exit 1
fi

PROGRAM="$(realpath "$1")"
shift

OUTPUT="/tmp/cpu_profile_$(whoami)_$(basename "$PROGRAM").trace"
echo "Profiling $PROGRAM into $OUTPUT" 1>&2
# Delete potential previous traces
rm -rf "$OUTPUT"
xcrun xctrace record \
  --template 'CPU Profiler' \
  --no-prompt \
  --output "$OUTPUT" \
  --target-stdout - \
  --launch -- "$PROGRAM" "$@"
open "$OUTPUT"
With this script, I can run the following command and get CPU profiling results in no time:
cpu_profile /usr/bin/grep \
  --recursive "Brendan Gregg" \
  "$(xcode-select --print-path)/Platforms/MacOSX.platform/Developer/SDKs/MacOSX.sdk"
Once you are inspecting the results in Instruments, you can
click the red record button in the left of the toolbar to record
a new take of the same program without invoking the
cpu_profile script again. Furthermore, you can go
back to previous takes through the menu bar with the
Document -> Previous Run and
Document -> Next Run options, or the left/right
arrow buttons at the center of the toolbar.
A Google Benchmark C++ example
Let’s now consider a more realistic example. The following
program uses the Google Benchmark library to measure inefficient
concatenation of standard C++ strings using the +=
addition assignment operator:
// string-concat.cc
#include <benchmark/benchmark.h>
#include <string> // std::string

auto ConcatenateStrings(benchmark::State &state) -> void {
  std::string result;
  for (auto _ : state) {
    for (auto index = 0; index < state.range(0); index++) {
      // Inefficient string concatenation!
      result += std::to_string(index);
    }

    benchmark::DoNotOptimize(result);
  }
}

BENCHMARK(ConcatenateStrings)->Arg(10000);
BENCHMARK_MAIN();
Google Benchmark is a pretty simple library. Consult the User Guide if it is your first time using it.
Assuming you have the Google Benchmark library installed
using Homebrew (i.e.
brew install google-benchmark), you can compile
this sample program for C++20 with debug information as
follows:
xcrun clang++ -std=c++20 -g string-concat.cc -o string-concat \
  -lbenchmark -L/opt/homebrew/lib -I/opt/homebrew/include
On my system, running the program prints the following information:
$ ./string-concat
2024-01-29T13:06:05-04:00
Running ./out
Run on (8 X 24 MHz CPU s)
CPU Caches:
  L1 Data 64 KiB
  L1 Instruction 128 KiB
  L2 Unified 4096 KiB (x8)
Load Average: 2.62, 2.42, 1.98
-------------------------------------------------------------------
Benchmark                         Time             CPU   Iterations
-------------------------------------------------------------------
ConcatenateStrings/10000     305428 ns       303609 ns         2276
Exploring the CPU profile results
With the cpu_profile script we introduced
before, we can perform a CPU profile of the
string-concat program from the previous section as
follows:
cpu_profile ./string-concatAfter a few seconds, you should see an Instruments window that looks something like this:
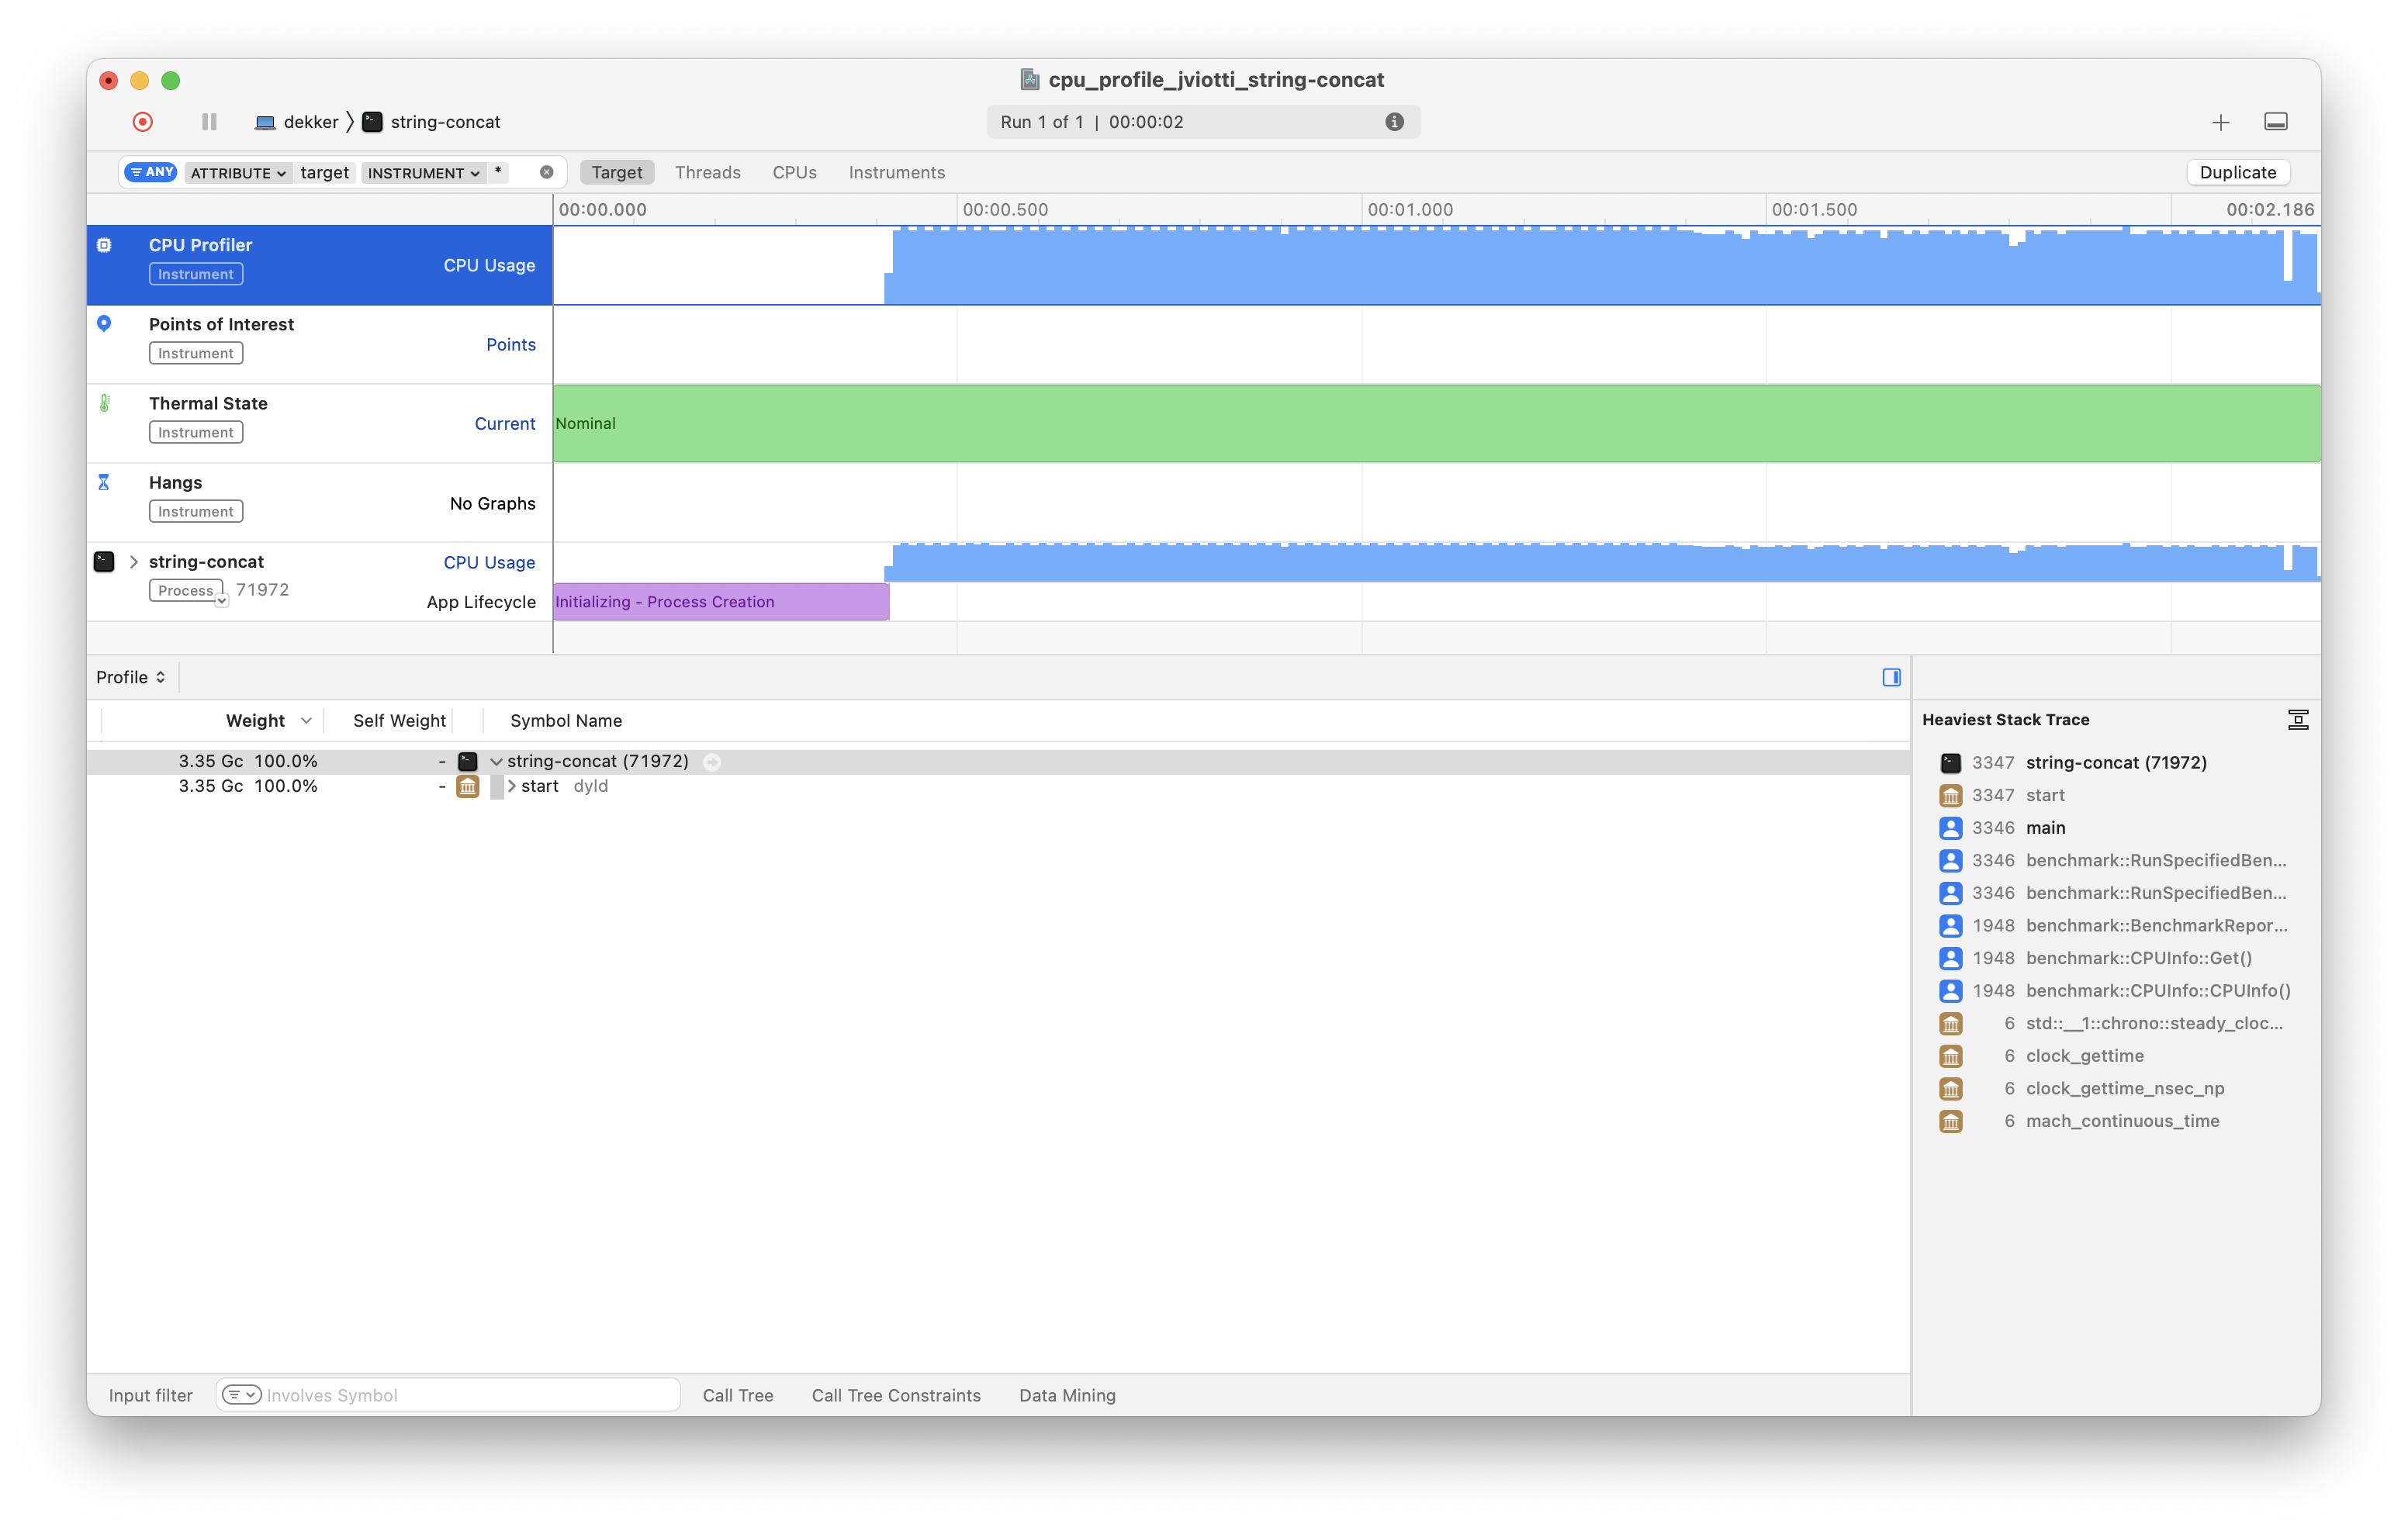
Taking this Google Benchmark program as an example, the rest of this section will go through the most important features of Instruments with regards to CPU profiling. If you have other tips and tricks, let me know!
The call tree
By default, the detail pane shows a hierarchical tree view of every procedure in the program in a top-down manner, alongside the total percentage of CPU time spent on each of them. We can expand each frame to see which other procedures such frame executes (if any) and their corresponding CPU time consumption.
As we can see at the top of the call tree, on Apple
platforms, program execution typically begins with the
start symbol of the dyld
dynamic linker (called by __dyld_start), which
jumps to the program offset specified by the
LC_MAIN Mach-O load command (typically
main). The call tree also reveals that the Google
Benchmark library performs its own initialization procedures
before executing the functions under test.
To learn more about program execution on Apple platforms, refer to the MacOS and iOS Internals, Volume I: User Mode book by Jonathan Levin.
To reduce a bit of the noise, we can filter the call tree for
the functions we are interested in using the Input
Filter text input in the bottom left of the detail pane.
For example, we can focus on the ConcatenateStrings
function as follows:
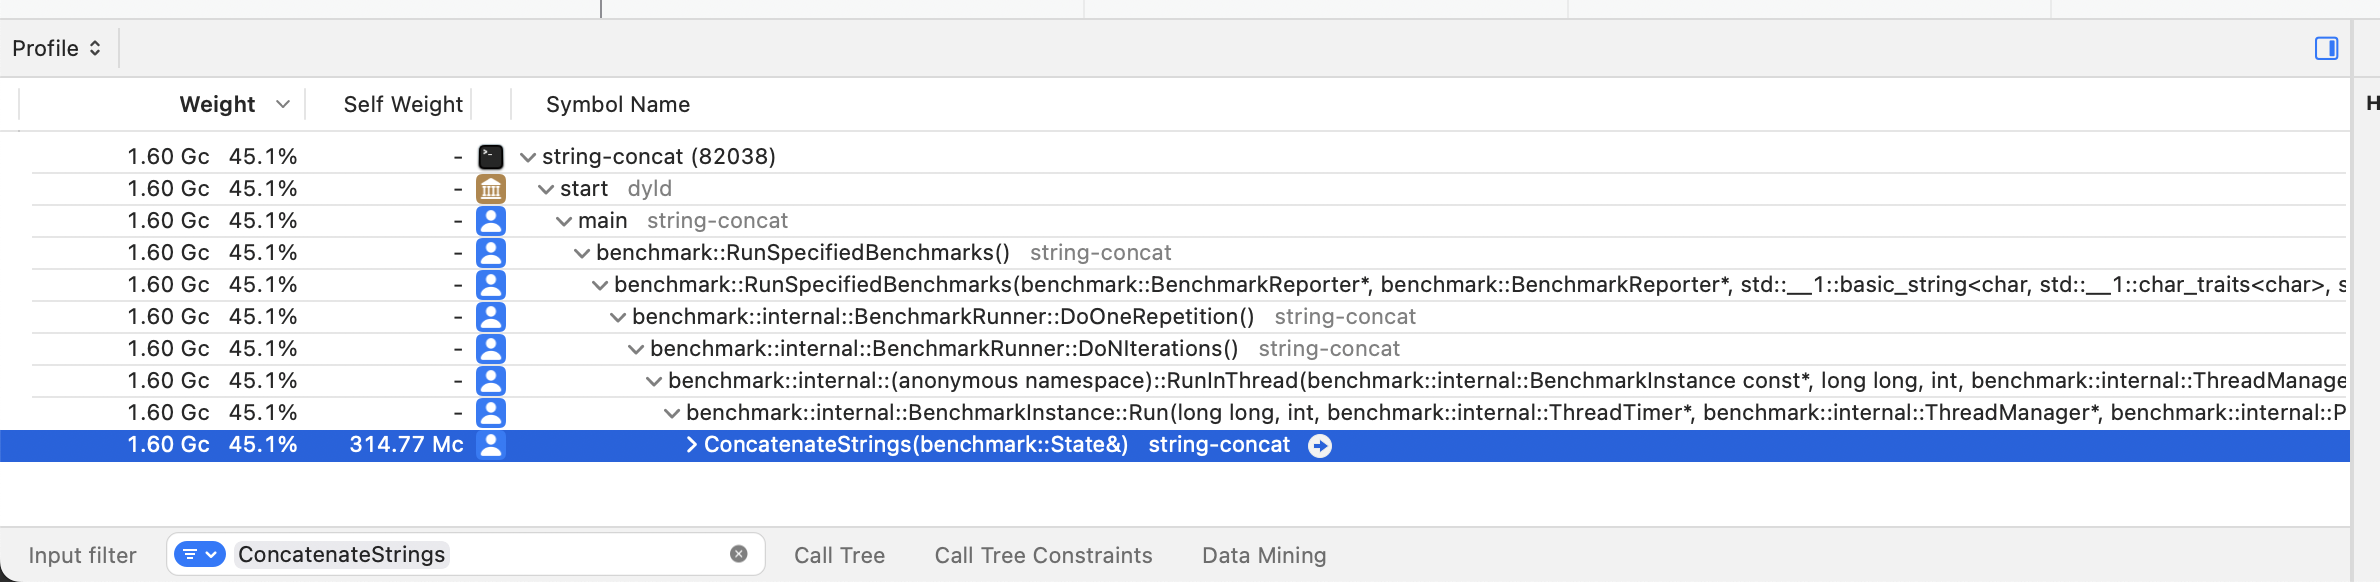
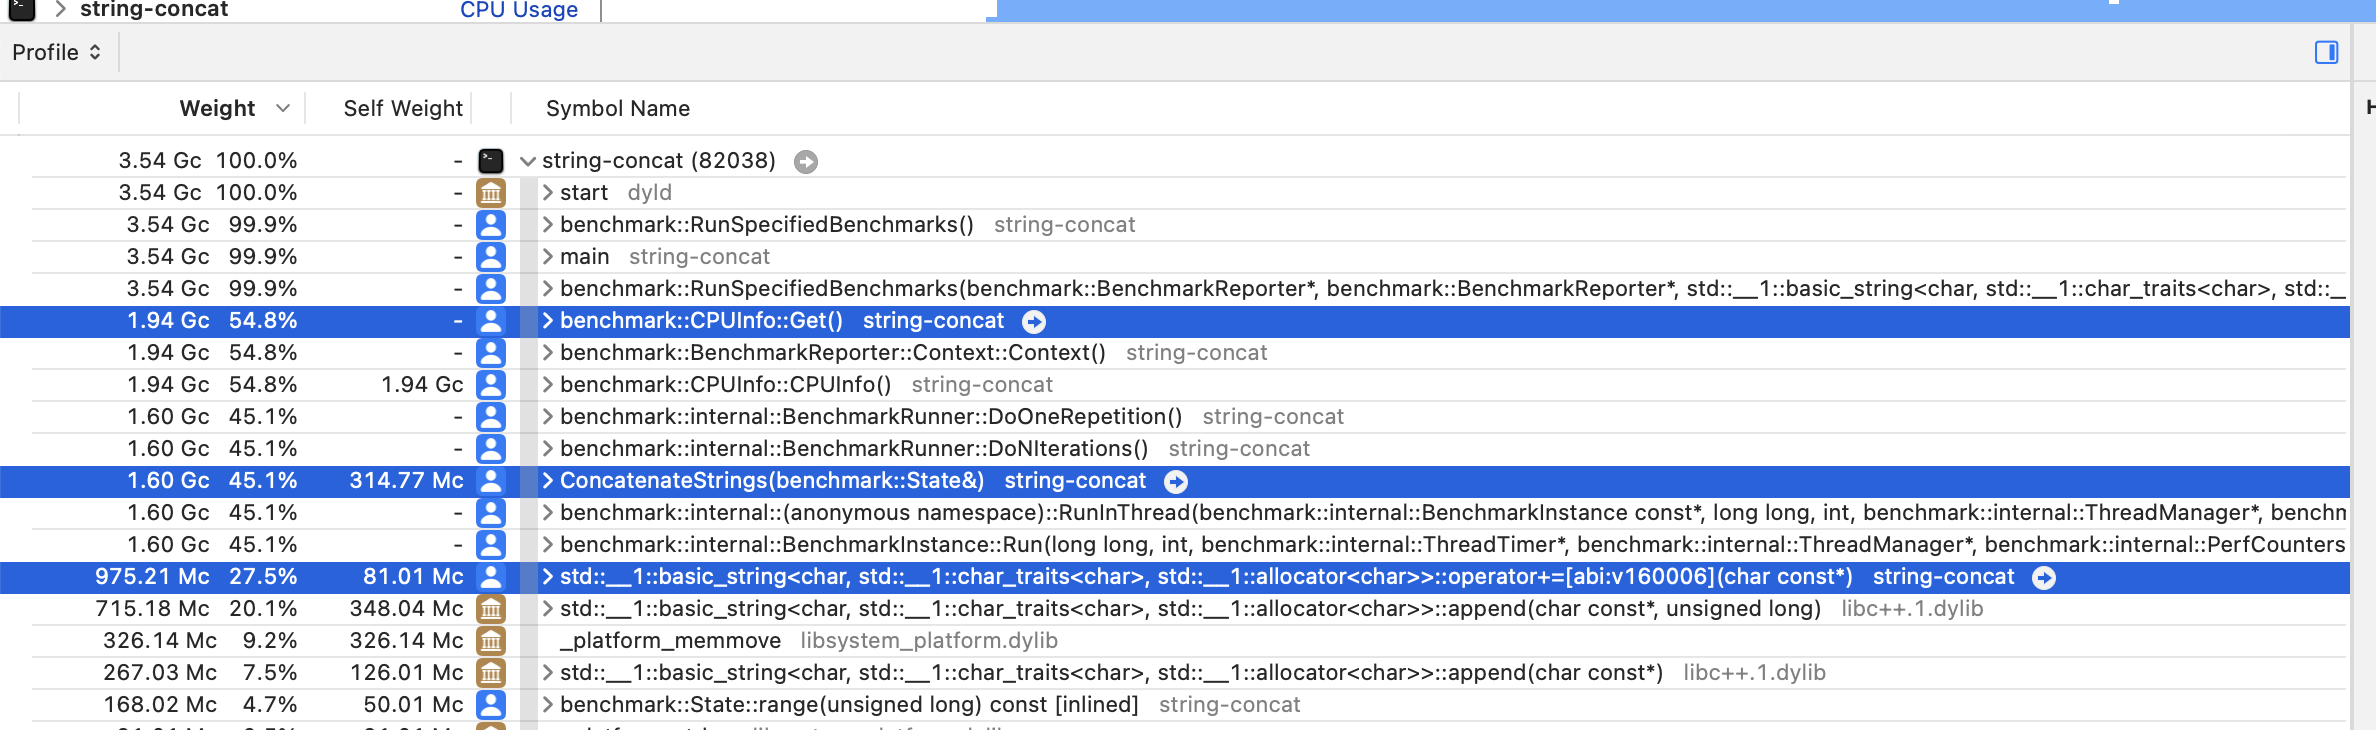
The call tree tells us that while executing the benchmark
program, the processor spent 45.1% of its time on the
ConcatenateStrings function.
If you are curious about the other ~54.9% of the CPU time, keep in mind that the Google Benchmark library incurs significant overhead for collecting micro measurements about the program execution. Try looking for
benchmark::CPUInfo::Get()in the call tree!
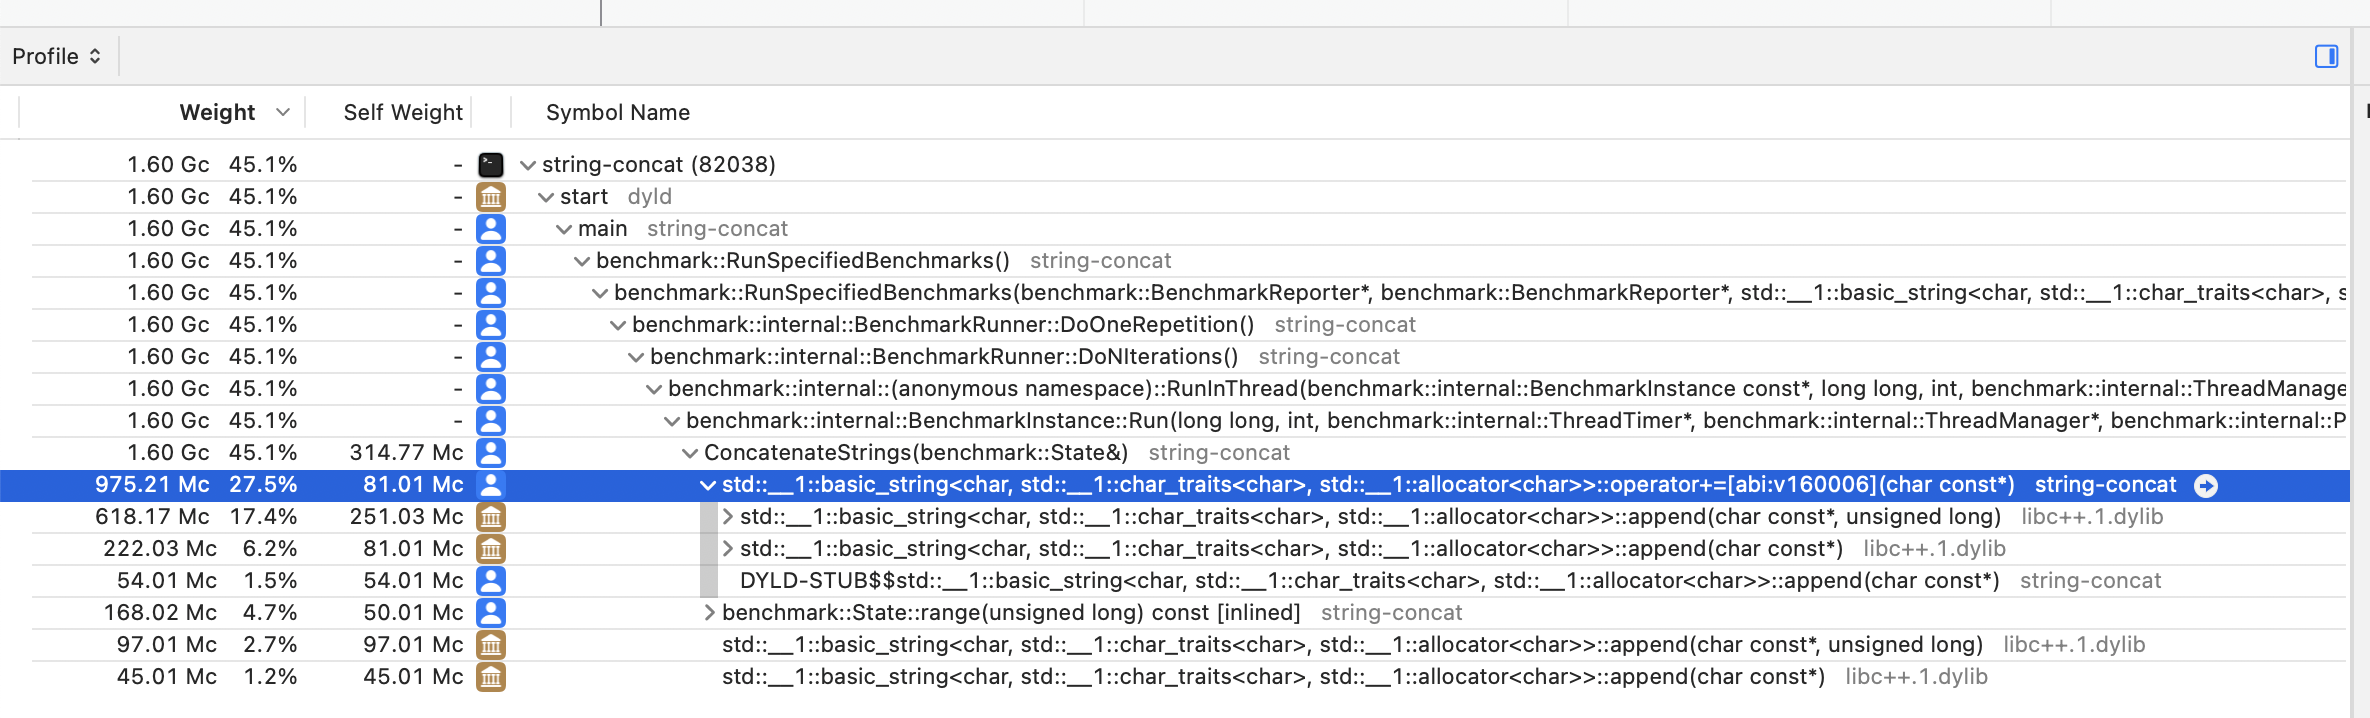
If we expand the tree view under the
ConcatenateStrings frame, we can see a breakdown of
the CPU time by the other functions that
ConcatenateStrings invokes. In this case, out of
the 45.1% of CPU time consumed by
ConcatenateStrings, 27.5% is consumed by the
std::basic_string::operator+= addition assignment
operator we are using to perform string concatenation:
Top functions
The default call tree view is useful for exploring the CPU time distribution of each function in a hierarchical manner. Another useful way to inspect the profile data is to flatten the tree view and sort the resulting list of procedures by CPU consumption. In this way, we can immediately spot the functions that consumed the most CPU time independently of their hierarchical call relationships.
To activate this view in Instruments, click on the Call Tree button at the bottom of the detail pane and check the Top Functions option as follows:
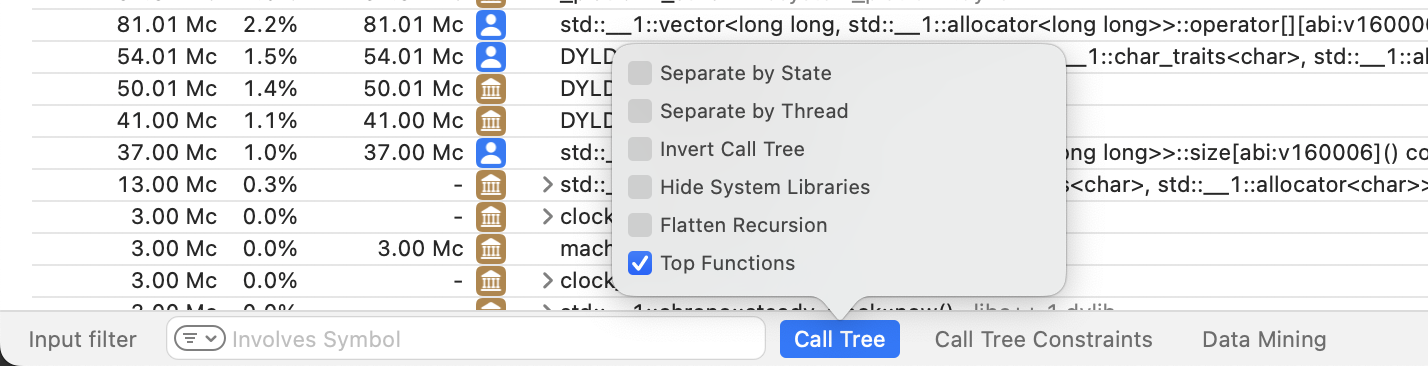
With the Top Functions view, the detail pane will surface the
ConcatenateStrings function, the addition
assignment std::basic_string method, and even the
benchmark::CPUInfo::Get method from Google
Benchmark that I mentioned in the previous section:
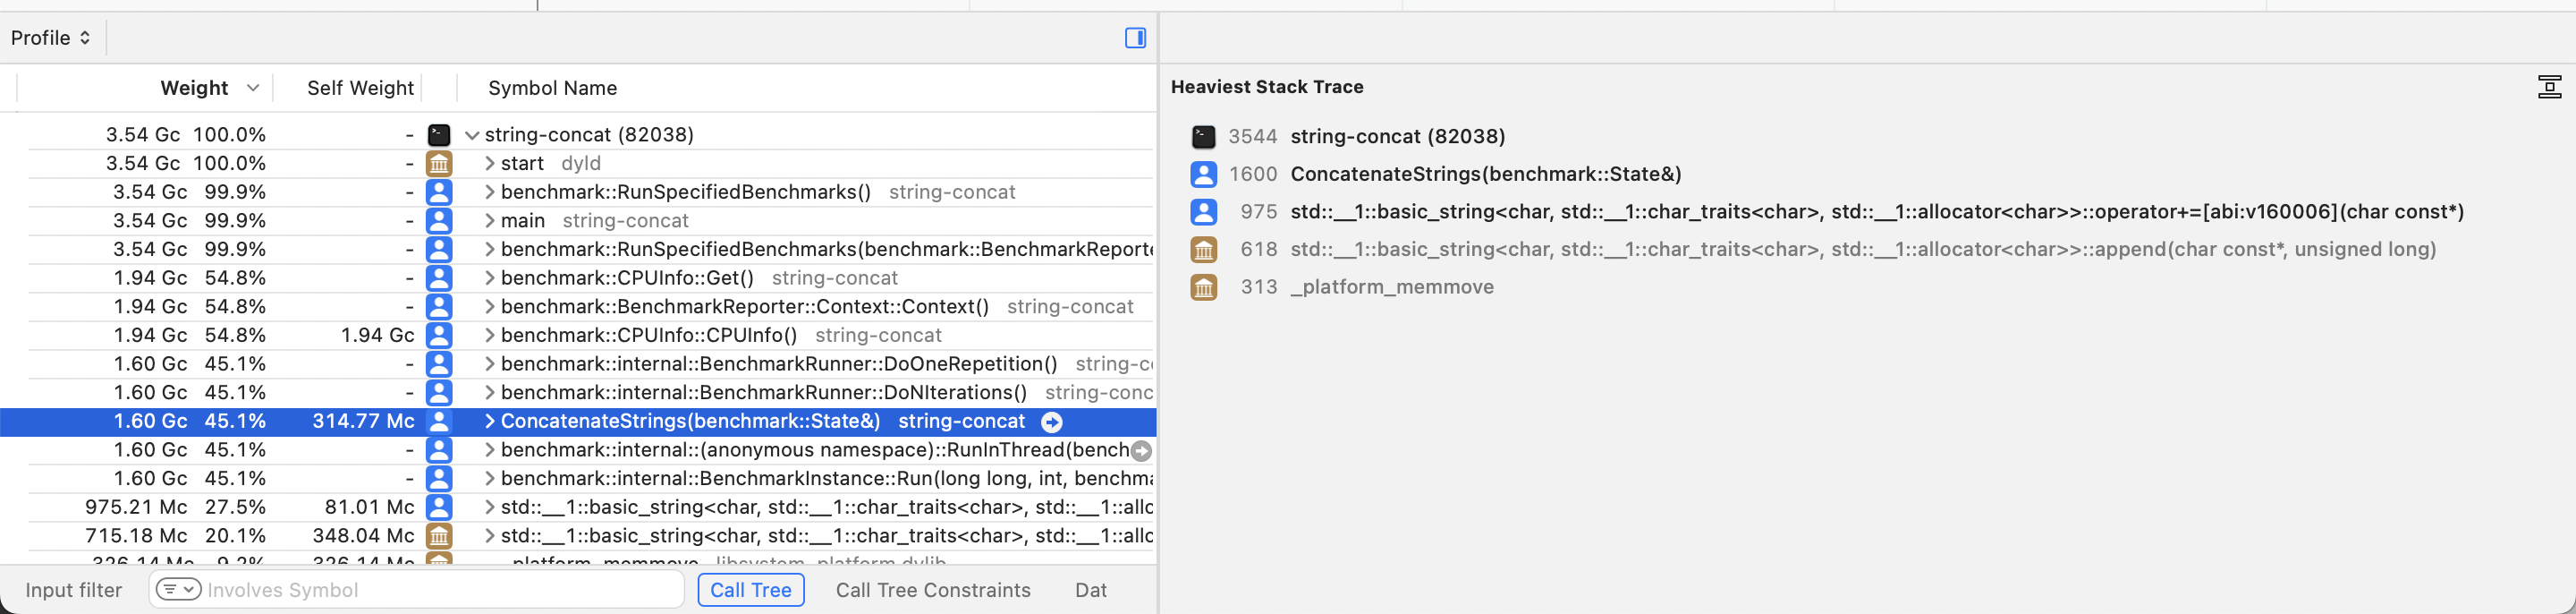
Heaviest stack trace
A convenient feature, mainly in conjunction with the Top Functions view described in the previous section, is the Heaviest Stack Trace view from the inspector pane. If we select a frame of interest in the detail pane, the inspector pane at the right will show us the most expensive stack trace in terms of CPU time that includes the symbol we selected. Even more, Instruments will automatically bold the frames in that stack trace that we are likely to be interested in.
For example, if we click on the
ConcatenateStrings frame in the detail pane, the
inspector pane will show us that the
ConcatenateStrings function calls the addition
assignment operator on std::basic_string, which in
turn calls the append method of
std::basic_string. Instruments will also bold the
addition assignment operator as a potential frame of
interest:
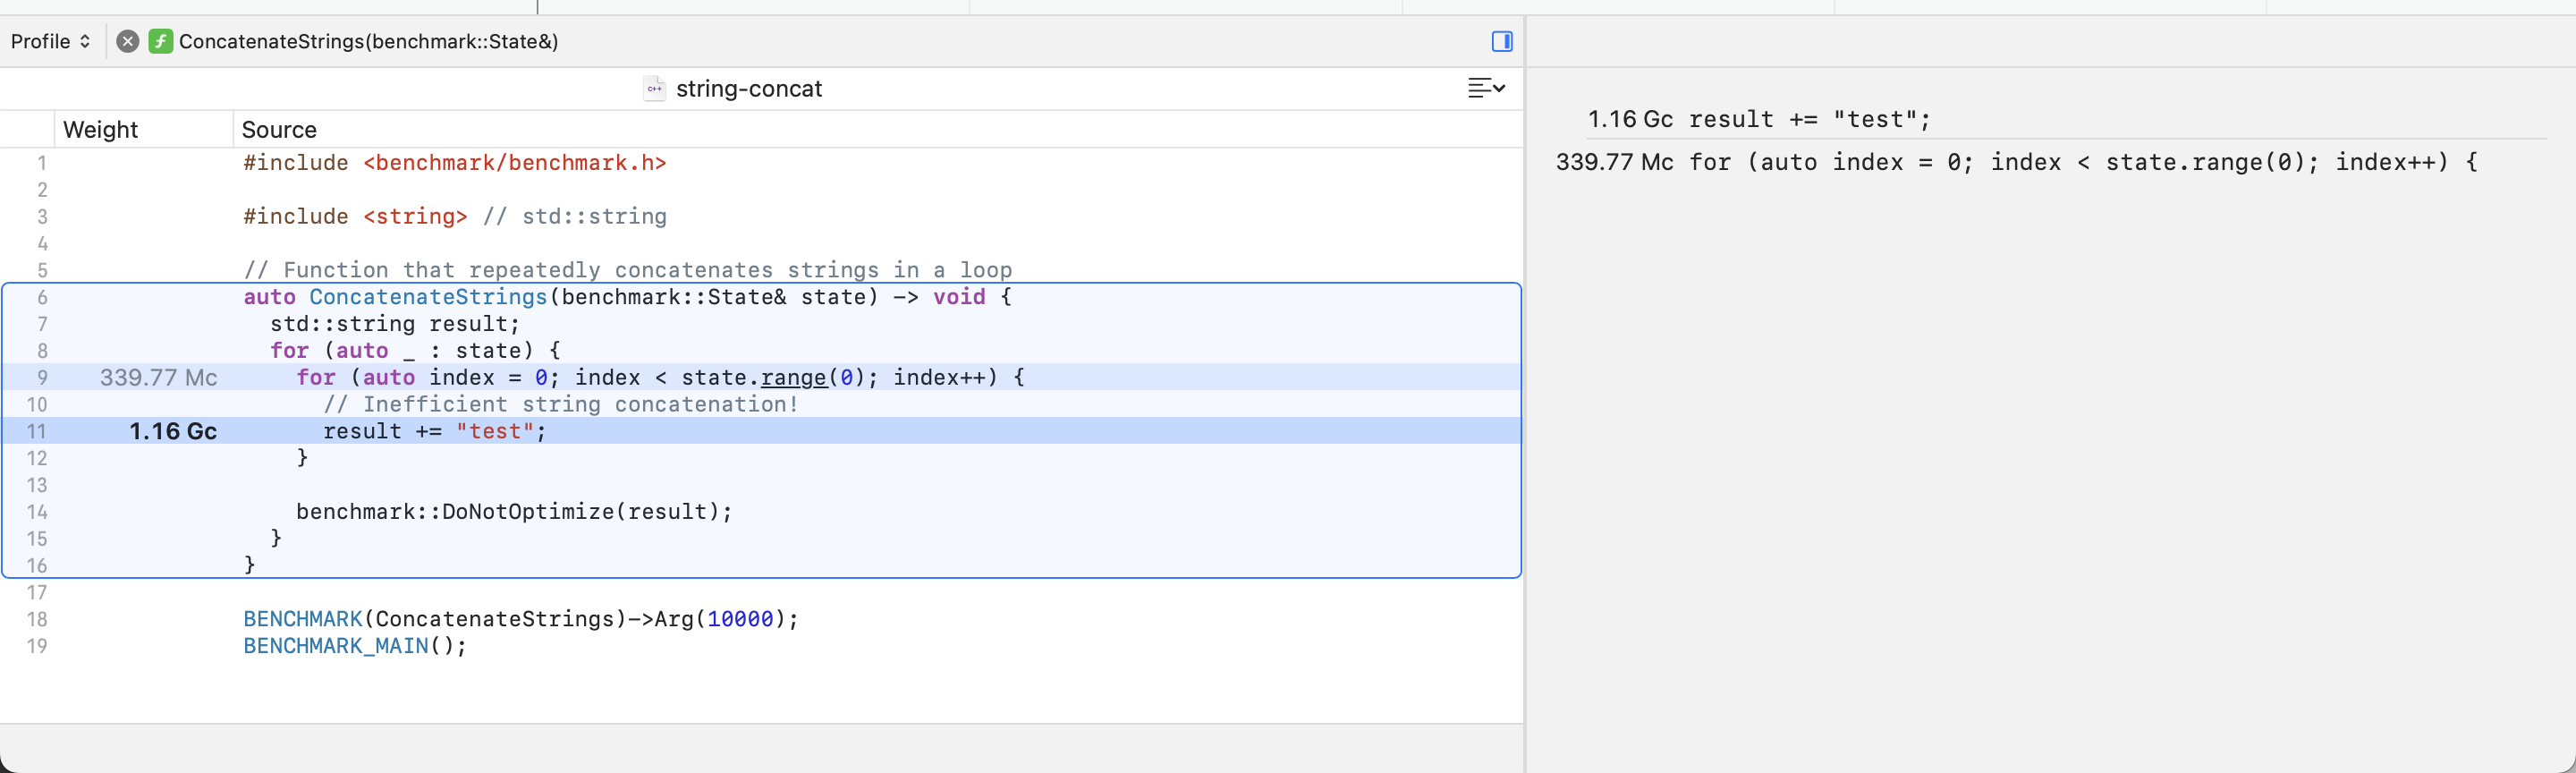
Exploring program code
If you have debugging symbols for the program you are profiling, you can double-click on a frame in the detail pane to see the source code of such function. In this view, Instruments will highlight the specific lines of code in the function that corresponds to the heaviest stack trace.
For example, if we double-click on the
ConcatenateStrings frame, Instruments will tell us
that most of the CPU time is spent on the for loop,
primarily due to the string addition assignment operator that
appends the string test to the result
variable. The inspector pane will also show us an index of the
lines of interest in the function:
If Instruments is unable to automatically detect your
debugging symbols, you can still configure them through the menu
bar at File -> Symbols.... You may also refer to
the official
documentation on configuring debugging symbols with
Instruments.
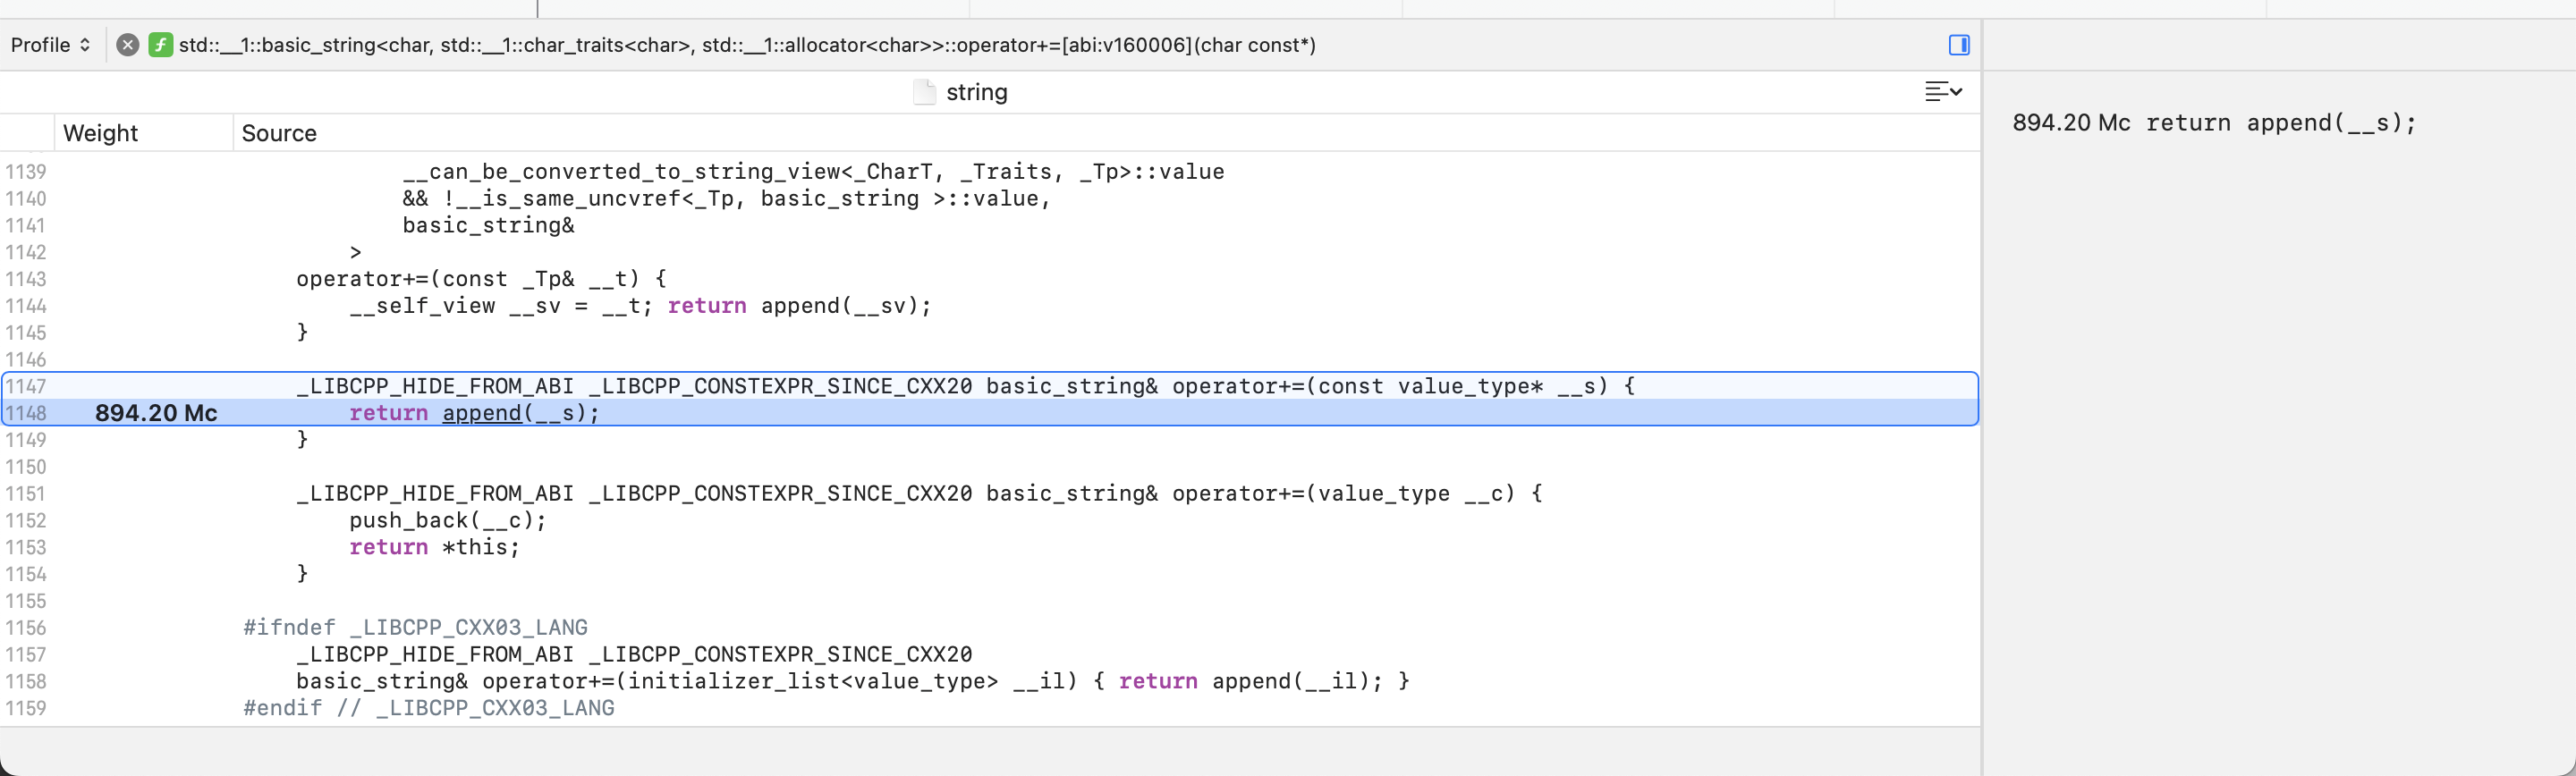
Exploring the C++ standard library
In the previous section, we saw how to use Instruments to inspect the program’s source code. In fact, Instruments is capable of exploring any frame in the profile, including the ones that correspond to the C++ standard library.
For example, if we double-click on the
std::basic_string addition assignment operator
frame, we can learn that (at least in LLVM) it is a thin wrapper
around the append method. This maps to what we saw
earlier while exploring the call tree and heaviest stack frame
of ConcatenateStrings:
Keep in mind that Apple does not distribute debugging symbols for the C++ standard library as part of Xcode. Therefore, you will only be able to inspect the code that is defined in its headers. Luckily, that covers most of it, as the C++ standard library is mostly template-based. If you still need to dig deeper, you can inspect the internals of the standard library by compiling your own like I covered in a previous article: Debugging the C++ standard library on macOS.
Summary
While we covered the basics of CPU profiling for C++ code on
macOS and various tips and tricks (such as the
xctrace command-line tool and exploring source code
with debugging symbols), we barely touched the surface of what
Instruments can do. If you want to learn more, a great next step
is to go through the official
Instruments documentation.
Finally, for more hands-on profiling, you might consider tweaking your program to emit signpost that complement the CPU profiling results like I described in a previous article: Emitting Signposts to Instruments on macOS using C++ (though keep in mind that Apple broke signposts on macOS Sonoma!)