Emitting Signposts to Instruments on macOS using C++
TL;DR: This article describes how to use the macOS Signposts API from C++ applications
Instruments is an application and tracing framework distributed with Xcode to help developers profile software on Apple devices. With Instruments, developers can trace general aspects such as CPU and network usage without requiring any application changes.
To enrich the profiling experience, macOS applications typically integrate with Instruments to emit application-specific traces that surface key areas of interest. The process of integrating with Instruments to emit these custom traces, internally referred to as signposts, is extensively documented in the context of the Swift programming language, and Objective-C to a lesser extent. However, you might not be aware that C++ applications can easily integrate with Instruments too.
The OS Logging API and the macOS SDK
The unified
logging system framework includes logging-related features
such as emitting logs to Console
and emitting signposts to Instruments. On macOS, the unified
logging framework is implemented in
libsystem_trace.dylib and its corresponding headers
are provided as part of MacOSX.sdk under
/usr/include/os (see
/path/to/Xcode.app/Contents/Developer/Platforms/MacOSX.platform/Developer/SDKs/MacOSX.sdk/usr/include/os).
The libsystem_trace.dylib library is re-exported by
libSystem.dylib, which is always linked by
clang(1) to every C++ macOS application.
For example, consider a dummy test C++ program
compiled with clang(1):
# (1) The `test` program links to /usr/lib/libSystem.B.dylib:
$ otool -L test
test:
        ...
        /usr/lib/libSystem.B.dylib (compatibility version 1.0.0, current version 1311.0.0)

# (2) The `/usr/lib/libSystem.B.dylib` library re-exports `libsystem_trace.dylib`:
$ otool -L /usr/lib/libSystem.B.dylib
/usr/lib/libSystem.B.dylib:
        ...
        /usr/lib/system/libsystem_trace.dylib (compatibility version 1.0.0, current version 1277.120.1, reexport)
        ...

# (3) The `libsystem_trace.dylib` library exports various `os_signpost` related public symbols:
$ nm -gU /usr/lib/system/libsystem_trace.dylib
...
00007fff200866a6 T __os_signpost_emit_impl
00007fff200917b8 T __os_signpost_emit_unreliably_impl
00007fff20089c6a T __os_signpost_emit_unreliably_with_name_impl
00007fff2008667f T __os_signpost_emit_with_name_impl
00007fff2008ac10 T __os_signpost_pack_fill
00007fff2008acbe T __os_signpost_pack_send
...
00007fff20082ad3 T _os_signpost_enabled
00007fff2008900a T _os_signpost_id_generate
00007fff20082a17 T _os_signpost_id_make_with_pointer
00007fff200916bb T _os_signpost_set_introspection_hook_4Perf
00007fff20088085 T _os_state_add_handler
00007fff20089c94 T _os_state_remove_handler
...
While we don’t have access to its source,
/usr/lib/system/libsystem_trace.dylib is likely
implemented using Objective-C due to the presence of
Objective-C-specific Mach-O sections as determined by
otool(1):
$ otool -o /usr/lib/system/libsystem_trace.dylib | grep objc
Contents of (__DATA_CONST,__objc_classlist) section
Contents of (__DATA,__objc_classrefs) section
Contents of (__DATA,__objc_superrefs) section
Contents of (__DATA_CONST,__objc_protolist) section
Contents of (__DATA,__objc_selrefs) section
Contents of (__DATA_CONST,__objc_imageinfo) section
If we take a look at the os/log.h and
os/signpost.h headers that implement the functions
that we are interested in, all of them are marked as
OS_NOTHROW, which means we can directly use these
symbols from within C++ without being concerned about
Objective-C exceptions.
Types of Signposts
Instruments supports two simple types of signposts: signposts
that represents events and signposts that
represent intervals. These types of signposts
are declared by the os_signpost_type_t
enumeration defined in os/signpost.h:
OS_ENUM(os_signpost_type, uint8_t,
    OS_SIGNPOST_EVENT           = 0x00,
    OS_SIGNPOST_INTERVAL_BEGIN  = 0x01,
    OS_SIGNPOST_INTERVAL_END    = 0x02,
);
Log Handles
Signposts and other types of logs are emitted into a log
handle represented using the os_log_t
opaque NSObject-based type. Log handles can be
created using the os_log_create
function defined in os/log.h. This function creates
a log handle given an identifier string for your application in
reverse DNS notation and a logging category. In the context of
signposts, the logging category is one of the following
constants defined in os/signpost.h:
OS_LOG_CATEGORY_POINTS_OF_INTEREST: The events and intervals recorded in this category will be displayed by default in Instruments. This category is often used for events and intervals that are cheap to record.OS_LOG_CATEGORY_DYNAMIC_TRACING: The events and intervals recorded in this category are disabled by default, and will only be recorded when dynamic tracing for the given subsystem is explicitly enabled from Instruments. This category is often used for events and intervals that are expensive to record.OS_LOG_CATEGORY_DYNAMIC_STACK_TRACING: This category is similar toOS_LOG_CATEGORY_DYNAMIC_TRACING. The only difference is that backtraces are also captured. We won’t cover this category in detail on this post.
For example, a log handle for the
OS_LOG_CATEGORY_DYNAMIC_TRACING category can be
obtained as follows:
#include <os/log.h>
#include <os/signpost.h>
...
os_log_t log_handle = os_log_create("com.jviotti.my-app", OS_LOG_CATEGORY_DYNAMIC_TRACING);
...
The os_signpost_enabled function takes a log
handle as an argument and returns a boolean that determines
whether an event or an interval emitted on such log handle will
be recorded or not. This function is useful for enclosing
expensive computation that is attached to events or intervals
emitted under the dynamic tracing category.
For example:
#include <os/log.h>
#include <os/signpost.h>
...
os_log_t log_handle = os_log_create("com.jviotti.my-app", OS_LOG_CATEGORY_DYNAMIC_TRACING);
...
if (os_signpost_enabled(log_handle))  {
  std::string data = perform_expensive_computation();
  os_signpost_event_emit(log_handle, ..., data.c_str());
}
The os_signpost_enabled function always returns
true for the
OS_LOG_CATEGORY_POINTS_OF_INTEREST category.
Typically, an application will create two log handles: one for cheap-to-emit points of interests and another one for expensive-to-emit dynamic tracing, and emit events and intervals accordingly.
Signpost Identifiers
There can be multiple signpost intervals with the same name
occurring at the same time. For this reason, recording a
signpost interval requires the presence of a signpost identifier
that can uniquely represent the given instance of the interval.
A signpost identifier is an unsigned 64-bit integer represented
by the os_signpost_id_t
type.
Generating Random Signpost Identifiers
Signpost identifiers are typically obtained using the
os_signpost_id_generate function. This function
takes a log handle as an argument and returns a random signpost
identifier. If the function fails,
OS_SIGNPOST_ID_INVALID (which is equal to
0xFFFFFFFFFFFFFFFF) is returned. For example:
#include <assert.h>
#include <os/signpost.h>
...
// Where `log_handle` is created using `os_log_create`
os_signpost_id_t signpost_id = os_signpost_id_generate(log_handle);
assert(signpost_id != OS_SIGNPOST_ID_INVALID);
Generating Signpost Identifiers From Pointers
Signpost identifiers can also be created from existing
pointers using the os_signpost_id_make_with_pointer
function. This function takes a log handle and a pointer as an
argument and returns a stable signpost identifier based on the
address of the pointer. If the function fails,
OS_SIGNPOST_ID_INVALID (which is equal to
0xFFFFFFFFFFFFFFFF) is returned. For example:
#include <assert.h>
#include <cstdlib>
#include <os/signpost.h>
...
void * pointer = std::malloc(8);
// Where `log_handle` is created using `os_log_create`
os_signpost_id_t signpost_id = os_signpost_id_make_with_pointer(log_handle, pointer);
assert(signpost_id != OS_SIGNPOST_ID_INVALID);
Addresses are process-specific, so it is not possible to use
os_signpost_id_make_with_pointer for recording
intervals across processes.
Avoiding Signpost Identifiers for Exclusive Intervals
There are cases in which the programmer can ensure that there
cannot be overlapping intervals with the same name. In such
case, the OS_SIGNPOST_ID_EXCLUSIVE signpost
identifier constant may be used. This constant is set by
os/signpost.h to a magic value that is guaranteed
to not be returned by os_signpost_id_generate and
os_signpost_id_make_with_pointer:
#define OS_SIGNPOST_ID_EXCLUSIVE ((os_signpost_id_t)0xEEEEB0B5B2B2EEEE)Casting to
uint64_t
The os/signpost.h header mentions that any other
existing value that can be casted to uint64_t and
that uniquely identifies an interval instance can be used as a
signpost identifier. However, the application must ensure that
this value is not equal to the reserved signpost identifiers
OS_SIGNPOST_ID_NULL,
OS_SIGNPOST_ID_EXCLUSIVE or
OS_SIGNPOST_ID_INVALID.
For example:
#include <assert.h>
#include <os/signpost.h>
...
os_signpost_id_t signpost_id = static_cast<os_signpost_id_t>(55);
assert(signpost_id != OS_SIGNPOST_ID_NULL);
assert(signpost_id != OS_SIGNPOST_ID_EXCLUSIVE);
assert(signpost_id != OS_SIGNPOST_ID_INVALID);
Matching Scopes
For signpost intervals, the matching scope of a given subsystem can be one of the following:
- Process: Only allow intervals within a single process.
- Thread: Allow intervals across threads.
- System: Allow intervals across processes.
The default matching scope is Process. This value
can be changed by modifying or creating a log handle
configuration plist at
/Library/Preferences/Logging/Subsystems/<subsystem>.plist
where subsystem corresponds to the subsystem declared
when calling os_log_create. The matching scope is
set with the Signpost-Scope key.
For example, a log handle configuration plist for the
com.jviotti.my-app subsystem that sets the matching
scope to Thread is set by creating a file called
com.jviotti.my-app.plist in
/Library/Preferences/Logging/Subsystems with the
following contents:
<?xml version="1.0" encoding="UTF-8"?>
<!DOCTYPE plist PUBLIC "-//Apple//DTD PLIST 1.0//EN" "http://www.apple.com/DTDs/PropertyList-1.0.dtd">
<plist version="1.0">
<dict>
  <key>Signpost-Scope</key>
  <string>Thread</string>
</dict>
</plist>
Emitting Signposts
The os/signpost.h header defines a variety of
functions to emit events and intervals given a log handle and a
signpost identifier:
os_signpost_event_emitos_signpost_interval_beginos_signpost_interval_endos_signpost_animation_interval_begin(undocumented)
These functions are macros implemented based on the os_signpost_emit_with_type
foundational macro, which is implemented based on the
OS_LOG_CALL_WITH_FORMAT_NAME macro from
os/trace_base.h and the
_os_signpost_emit_with_name_impl internal function
defined in os/signpost.h.
Emitting Events
Events are emitted using the os_signpost_event_emit
utility macro, which takes a log handle, a signpost identifier,
a string that determines the name of the event and a string of
metadata as arguments. The string of metadata may include
printf(3) C-style formatted strings, where the
corresponding values are passed as extra arguments.
For example:
os_signpost_event_emit(log_handle, signpost_id, "My first event", "Some metadata: %s", "Foo");Emitting Intervals
Intervals are emitted using the os_signpost_interval_begin
and os_signpost_interval_end
complementary utility macros, which take a log handle, a
signpost identifier, a string that determines the name of the
interval and a string of metadata as arguments. As with
os_signpost_event_emit, the string of metadata may
include printf(3) C-style formatted strings, where
the corresponding values are passed as extra arguments.
For example:
// The log handle, the signpost identifier and the interval name must match
os_signpost_interval_begin(log_handle, signpost_id, "My first interval", "Begin metadata: %s", "Foo");
...
os_signpost_interval_end(log_handle, signpost_id, "My first interval", "End metadata: %s", "Foo");
The os_signpost_animation_interval_begin
function is a thin wrapper around
os_signpost_interval_begin that appends
isAnimation=YES to the metadata string. Instruments
does not seem to display an interval started with
os_signpost_animation_interval_begin in a special
way other than displaying the isAnimation=YES
string.
Examples
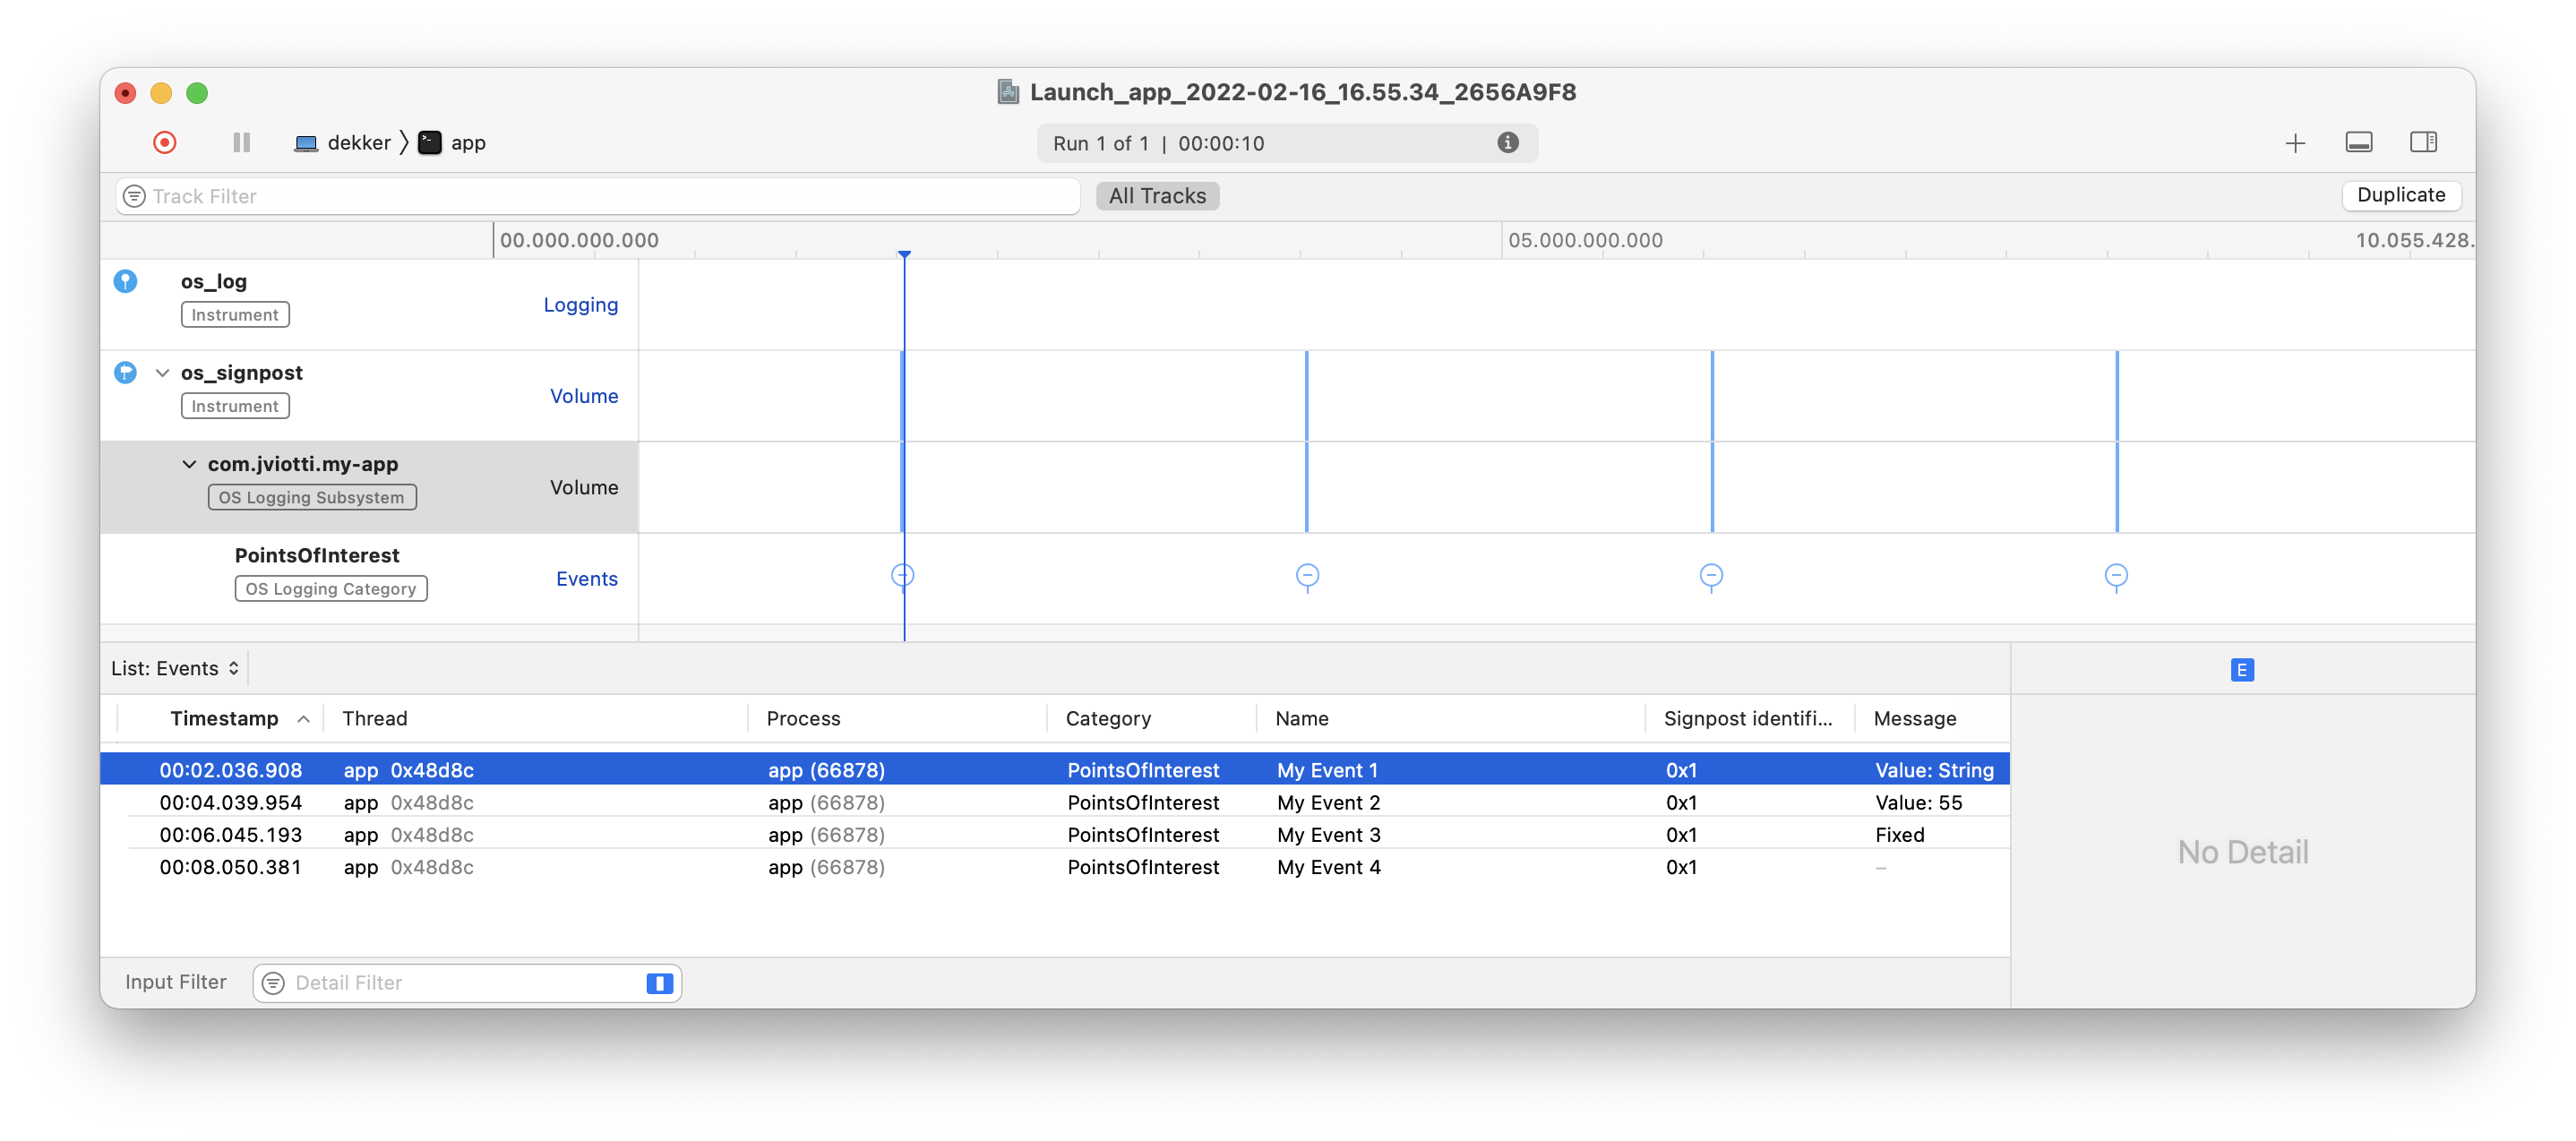
Points of Interest Events
In this example, we emit 4 events to the
OS_LOG_CATEGORY_POINTS_OF_INTEREST category,
waiting 2 seconds before emitting the next event. Each event has
a different name and different metadata strings. In particular,
the fourth event does not make use of a metadata string at
all.
#include <thread>
#include <chrono>

#include <os/log.h>
#include <os/signpost.h>

int main() {
  os_log_t log_handle = os_log_create("com.jviotti.my-app", OS_LOG_CATEGORY_POINTS_OF_INTEREST);
  os_signpost_id_t signpost_id = os_signpost_id_generate(log_handle);
  assert(signpost_id != OS_SIGNPOST_ID_INVALID);

  std::this_thread::sleep_for(std::chrono::seconds(2));
  os_signpost_event_emit(log_handle, signpost_id, "My Event 1", "Value: %s", "String");
  std::this_thread::sleep_for(std::chrono::seconds(2));
  os_signpost_event_emit(log_handle, signpost_id, "My Event 2", "Value: %i", 55);
  std::this_thread::sleep_for(std::chrono::seconds(2));
  os_signpost_event_emit(log_handle, signpost_id, "My Event 3", "Fixed");
  std::this_thread::sleep_for(std::chrono::seconds(2));
  os_signpost_event_emit(log_handle, signpost_id, "My Event 4");
  std::this_thread::sleep_for(std::chrono::seconds(2));

  return 0;
}
We will compile the program with clang(1), trace
the program using Instruments’ command-line tool
xctrace(1) and open the resulting
.trace file on the Instruments application.
$ clang++ app.cc -o app
$ xcrun xctrace record --template Logging --launch -- ./app
Starting recording with the Logging template. Launching process: app.
Ctrl-C to stop the recording
Target app exited, ending recording...
Recording completed. Saving output file...
Output file saved as: Launch_app_2022-02-16_16.55.34_2656A9F8.trace.
$ open Launch_app_2022-02-16_16.55.34_2656A9F8.trace
The result looks like this. To see the details, expand the
os_signpost instrument, click the
PointsOfInterest category for your subsystem and
switch to the List: Events view.
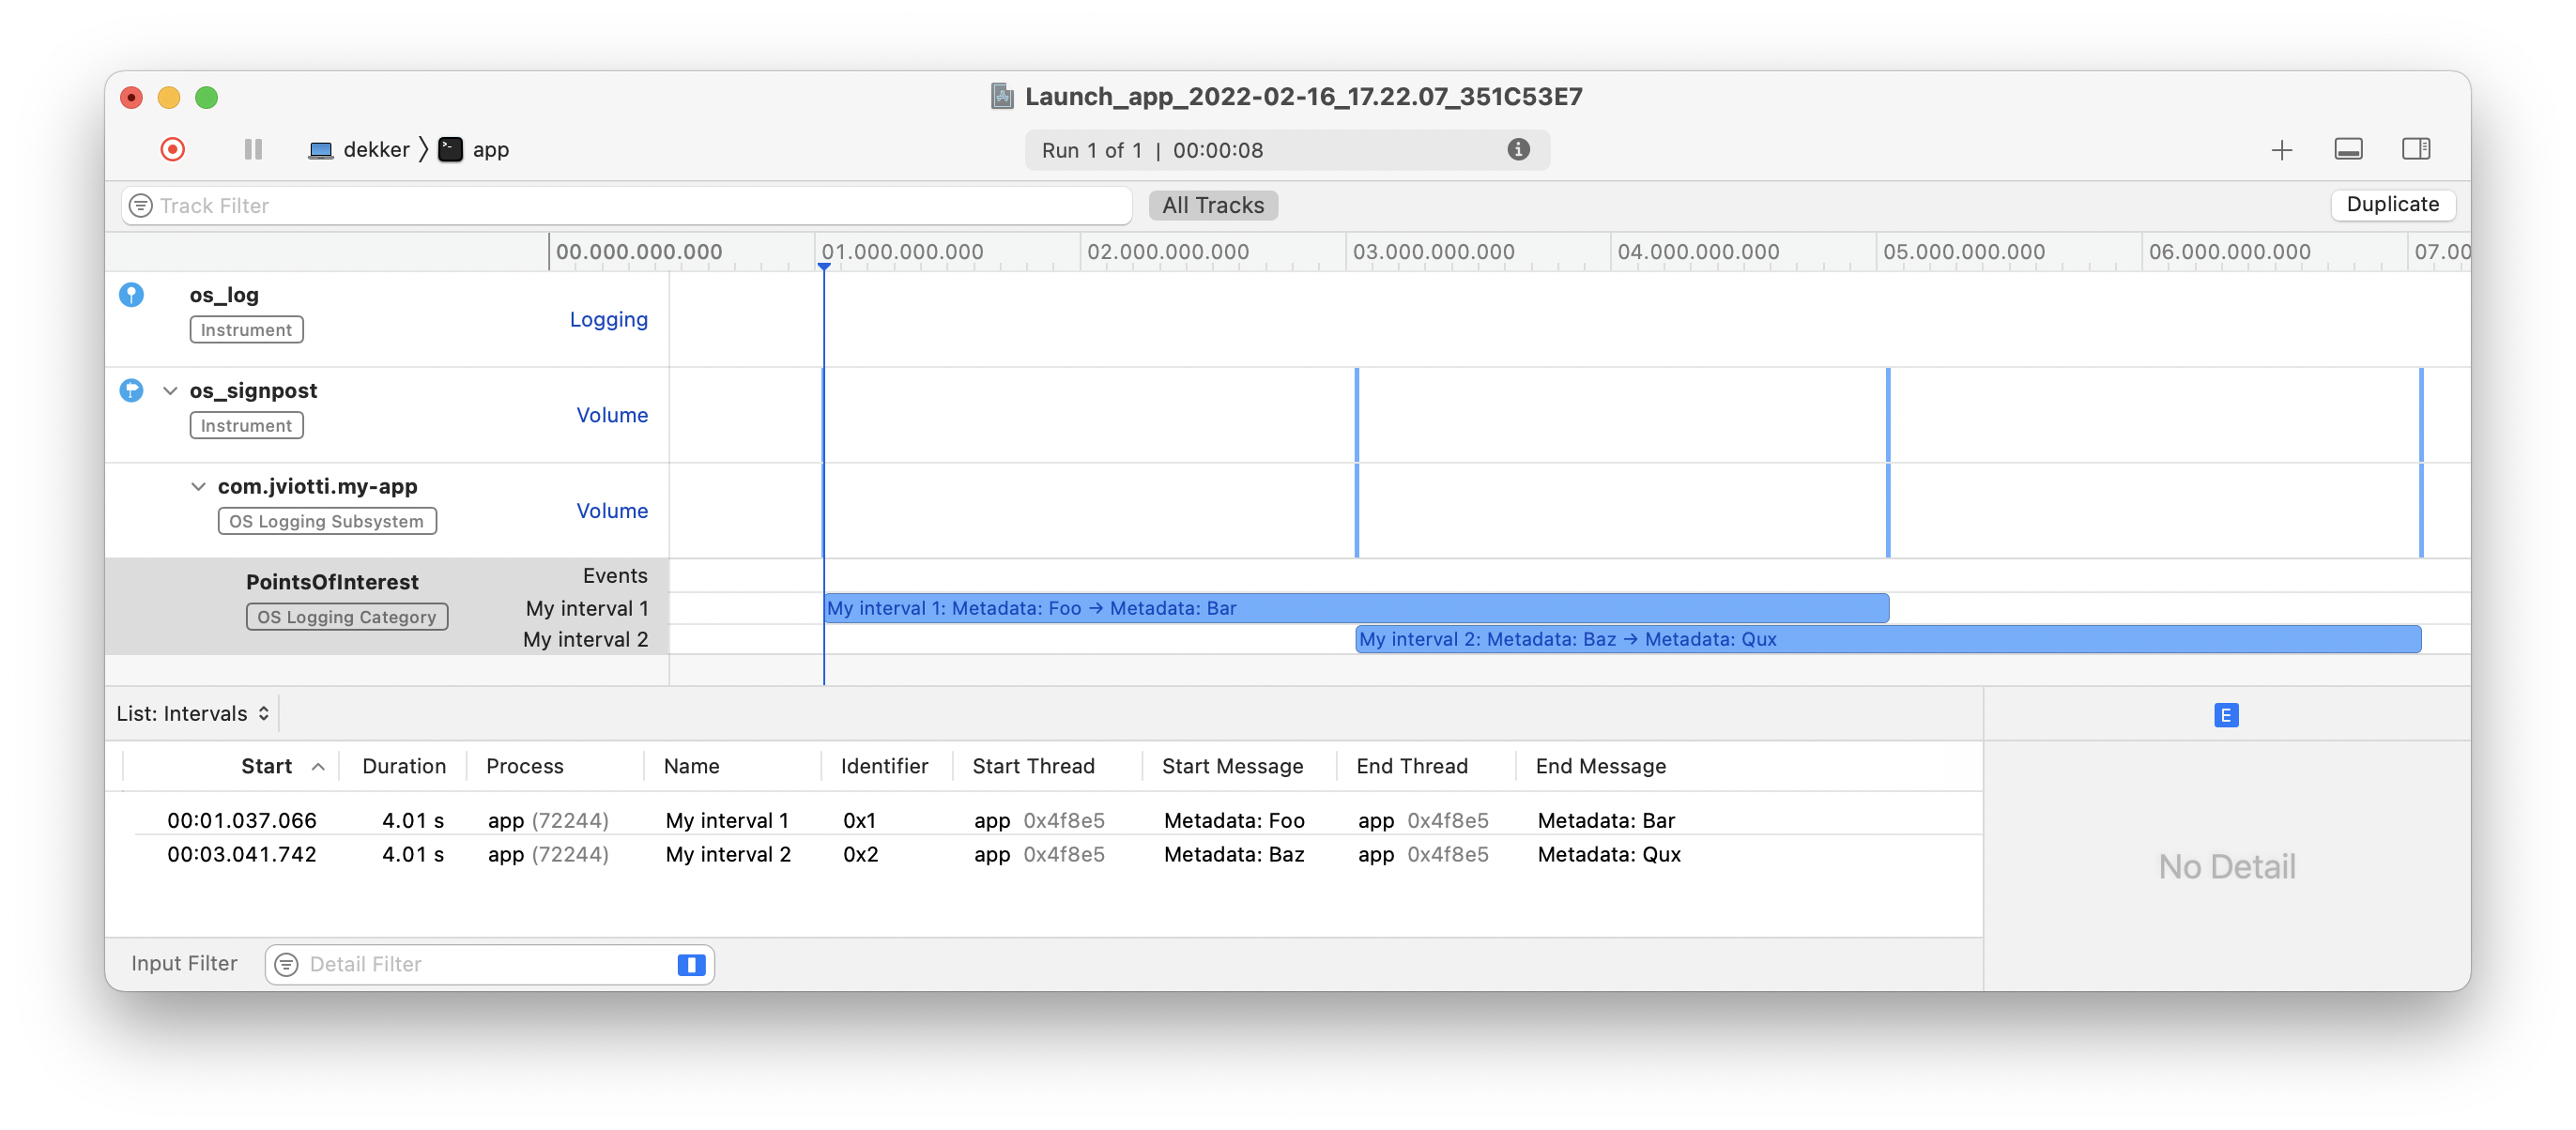
Points of Interest Intervals
In this example, we emit 2 overlapping 4-second intervals to
the OS_LOG_CATEGORY_POINTS_OF_INTEREST category.
Each interval has a different name and different metadata
strings.
#include <thread>
#include <chrono>

#include <os/log.h>
#include <os/signpost.h>

int main() {
  os_log_t log_handle = os_log_create("com.jviotti.my-app", OS_LOG_CATEGORY_POINTS_OF_INTEREST);
  os_signpost_id_t signpost_id_1 = os_signpost_id_generate(log_handle);
  os_signpost_id_t signpost_id_2 = os_signpost_id_generate(log_handle);
  assert(signpost_id_1 != OS_SIGNPOST_ID_INVALID);
  assert(signpost_id_2 != OS_SIGNPOST_ID_INVALID);

  std::this_thread::sleep_for(std::chrono::seconds(1));
  os_signpost_interval_begin(log_handle, signpost_id_1, "My interval 1", "Metadata: %s", "Foo");
  std::this_thread::sleep_for(std::chrono::seconds(2));
  os_signpost_interval_begin(log_handle, signpost_id_2, "My interval 2", "Metadata: %s", "Baz");
  std::this_thread::sleep_for(std::chrono::seconds(2));
  os_signpost_interval_end(log_handle, signpost_id_1, "My interval 1", "Metadata: %s", "Bar");
  std::this_thread::sleep_for(std::chrono::seconds(2));
  os_signpost_interval_end(log_handle, signpost_id_2, "My interval 2", "Metadata: %s", "Qux");
  std::this_thread::sleep_for(std::chrono::seconds(1));

  return 0;
}
We will compile the program with clang(1), trace
the program using Instruments’ command-line tool
xctrace(1) and open the resulting
.trace file on the Instruments application.
$ clang++ app.cc -o app
$ xcrun xctrace record --template Logging --launch -- ./app
Starting recording with the Logging template. Launching process: app.
Ctrl-C to stop the recording
Target app exited, ending recording...
Recording completed. Saving output file...
Output file saved as: Launch_app_2022-02-16_17.22.07_351C53E7.trace.
$ open Launch_app_2022-02-16_17.22.07_351C53E7.trace
The result looks like this. To see the details, expand the
os_signpost instrument, click the
PointsOfInterest category for your subsystem and
switch to the List: Intervals view.
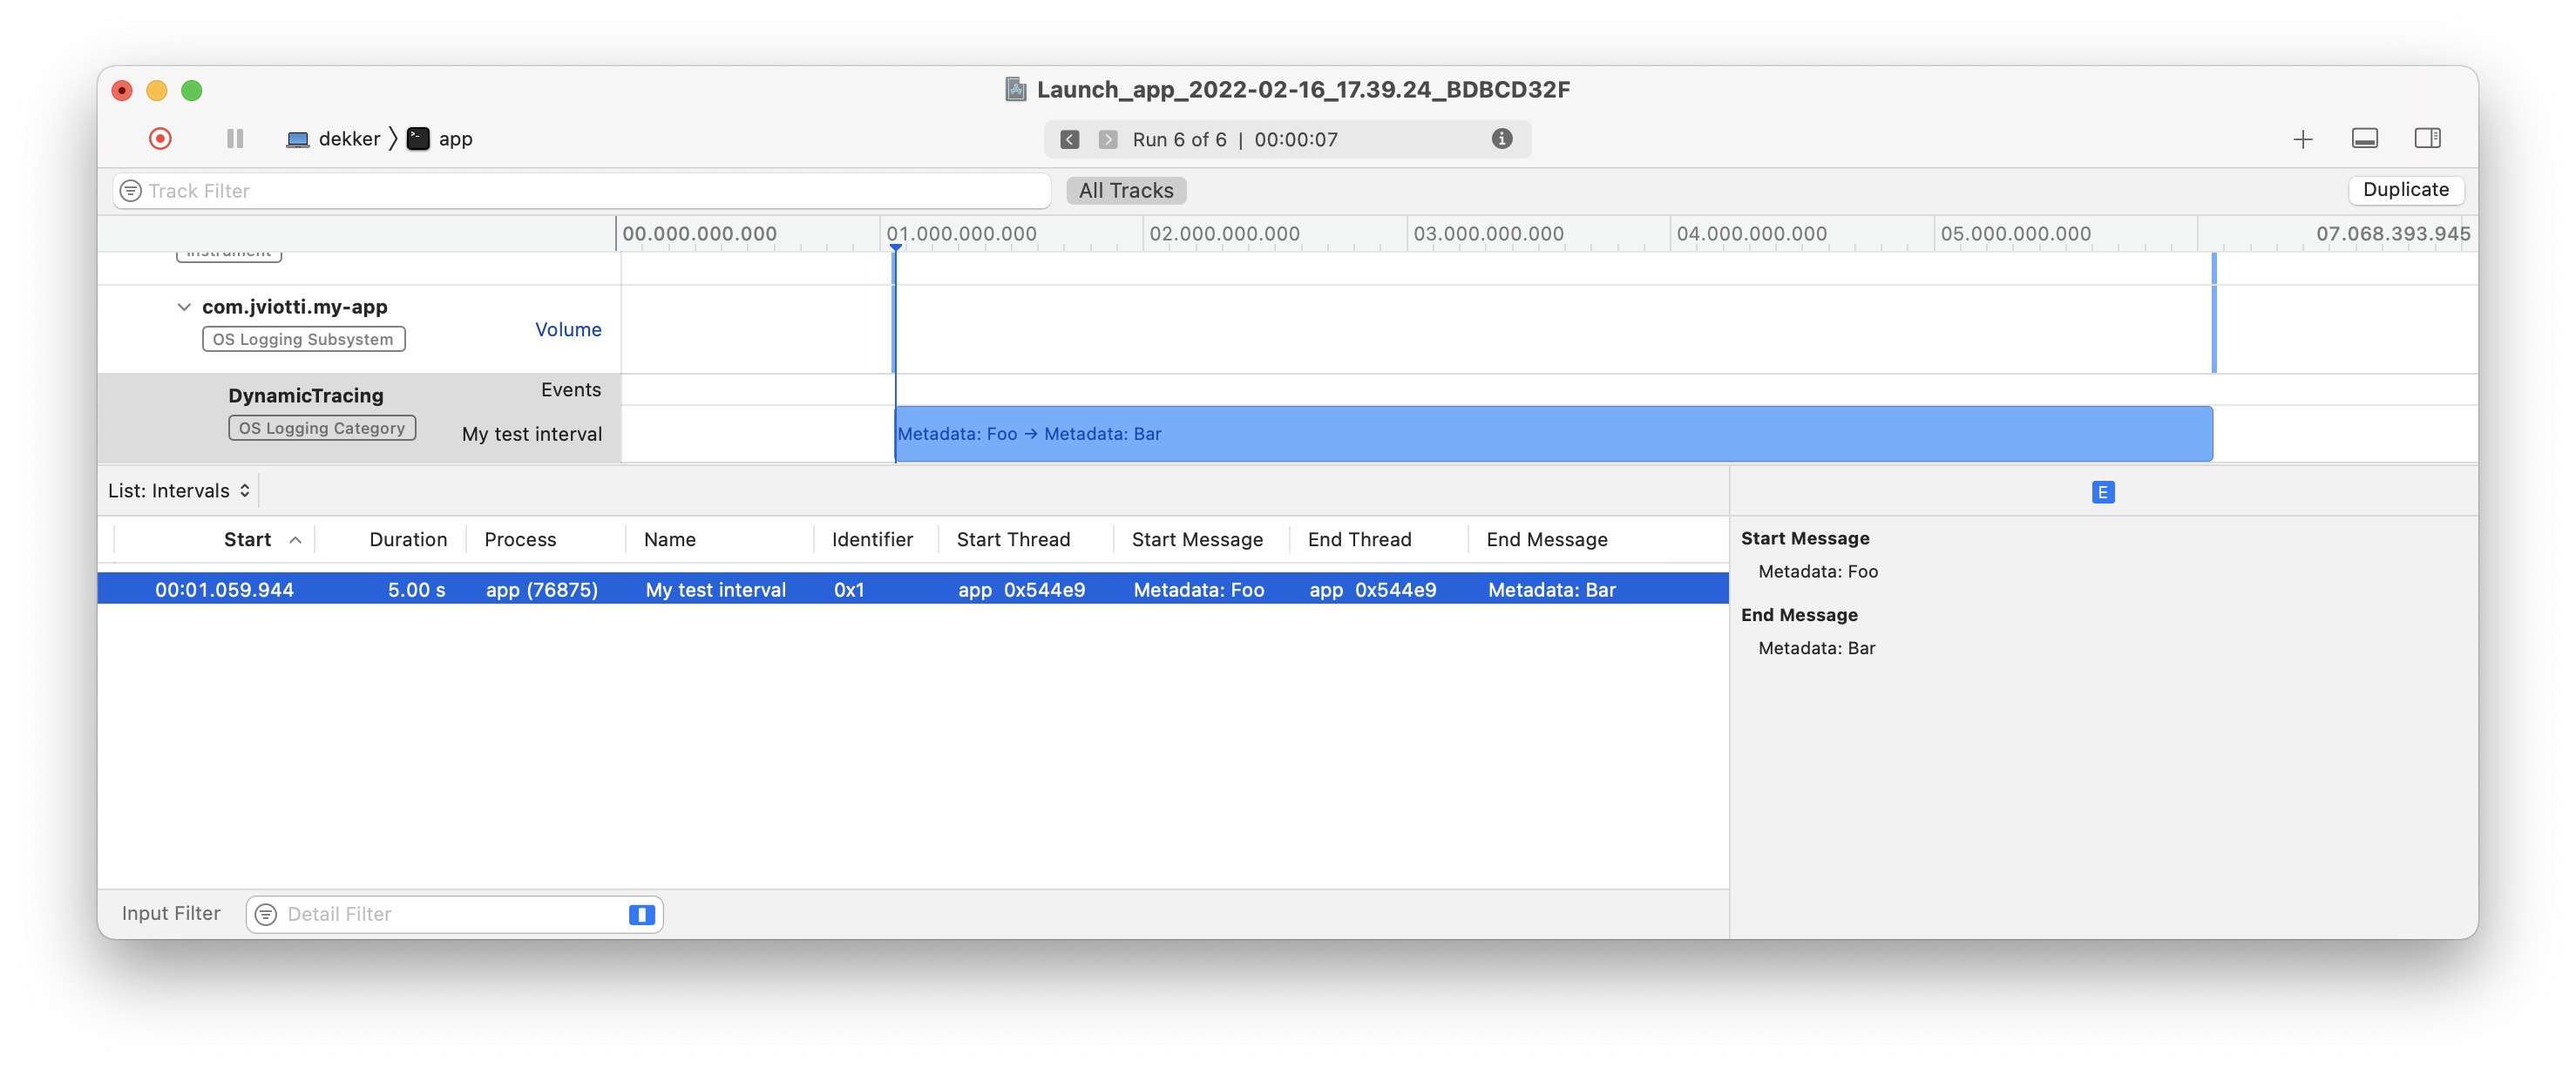
Dynamic Tracing Interval
In this example, we emit a single 5-second interval to the
OS_LOG_CATEGORY_DYNAMIC_TRACING category.
#include <thread>
#include <chrono>
#include <os/log.h>
#include <os/signpost.h>
int main() {
os_log_t log_handle = os_log_create("com.jviotti.my-app", OS_LOG_CATEGORY_DYNAMIC_TRACING);
os_signpost_id_t signpost_id = os_signpost_id_generate(log_handle);
assert(signpost_id != OS_SIGNPOST_ID_INVALID);
std::this_thread::sleep_for(std::chrono::seconds(1));
os_signpost_interval_begin(log_handle, signpost_id, "My test interval", "Metadata: %s", "Foo");
std::this_thread::sleep_for(std::chrono::seconds(5));
os_signpost_interval_end(log_handle, signpost_id, "My test interval", "Metadata: %s", "Bar");
std::this_thread::sleep_for(std::chrono::seconds(1));
return 0;
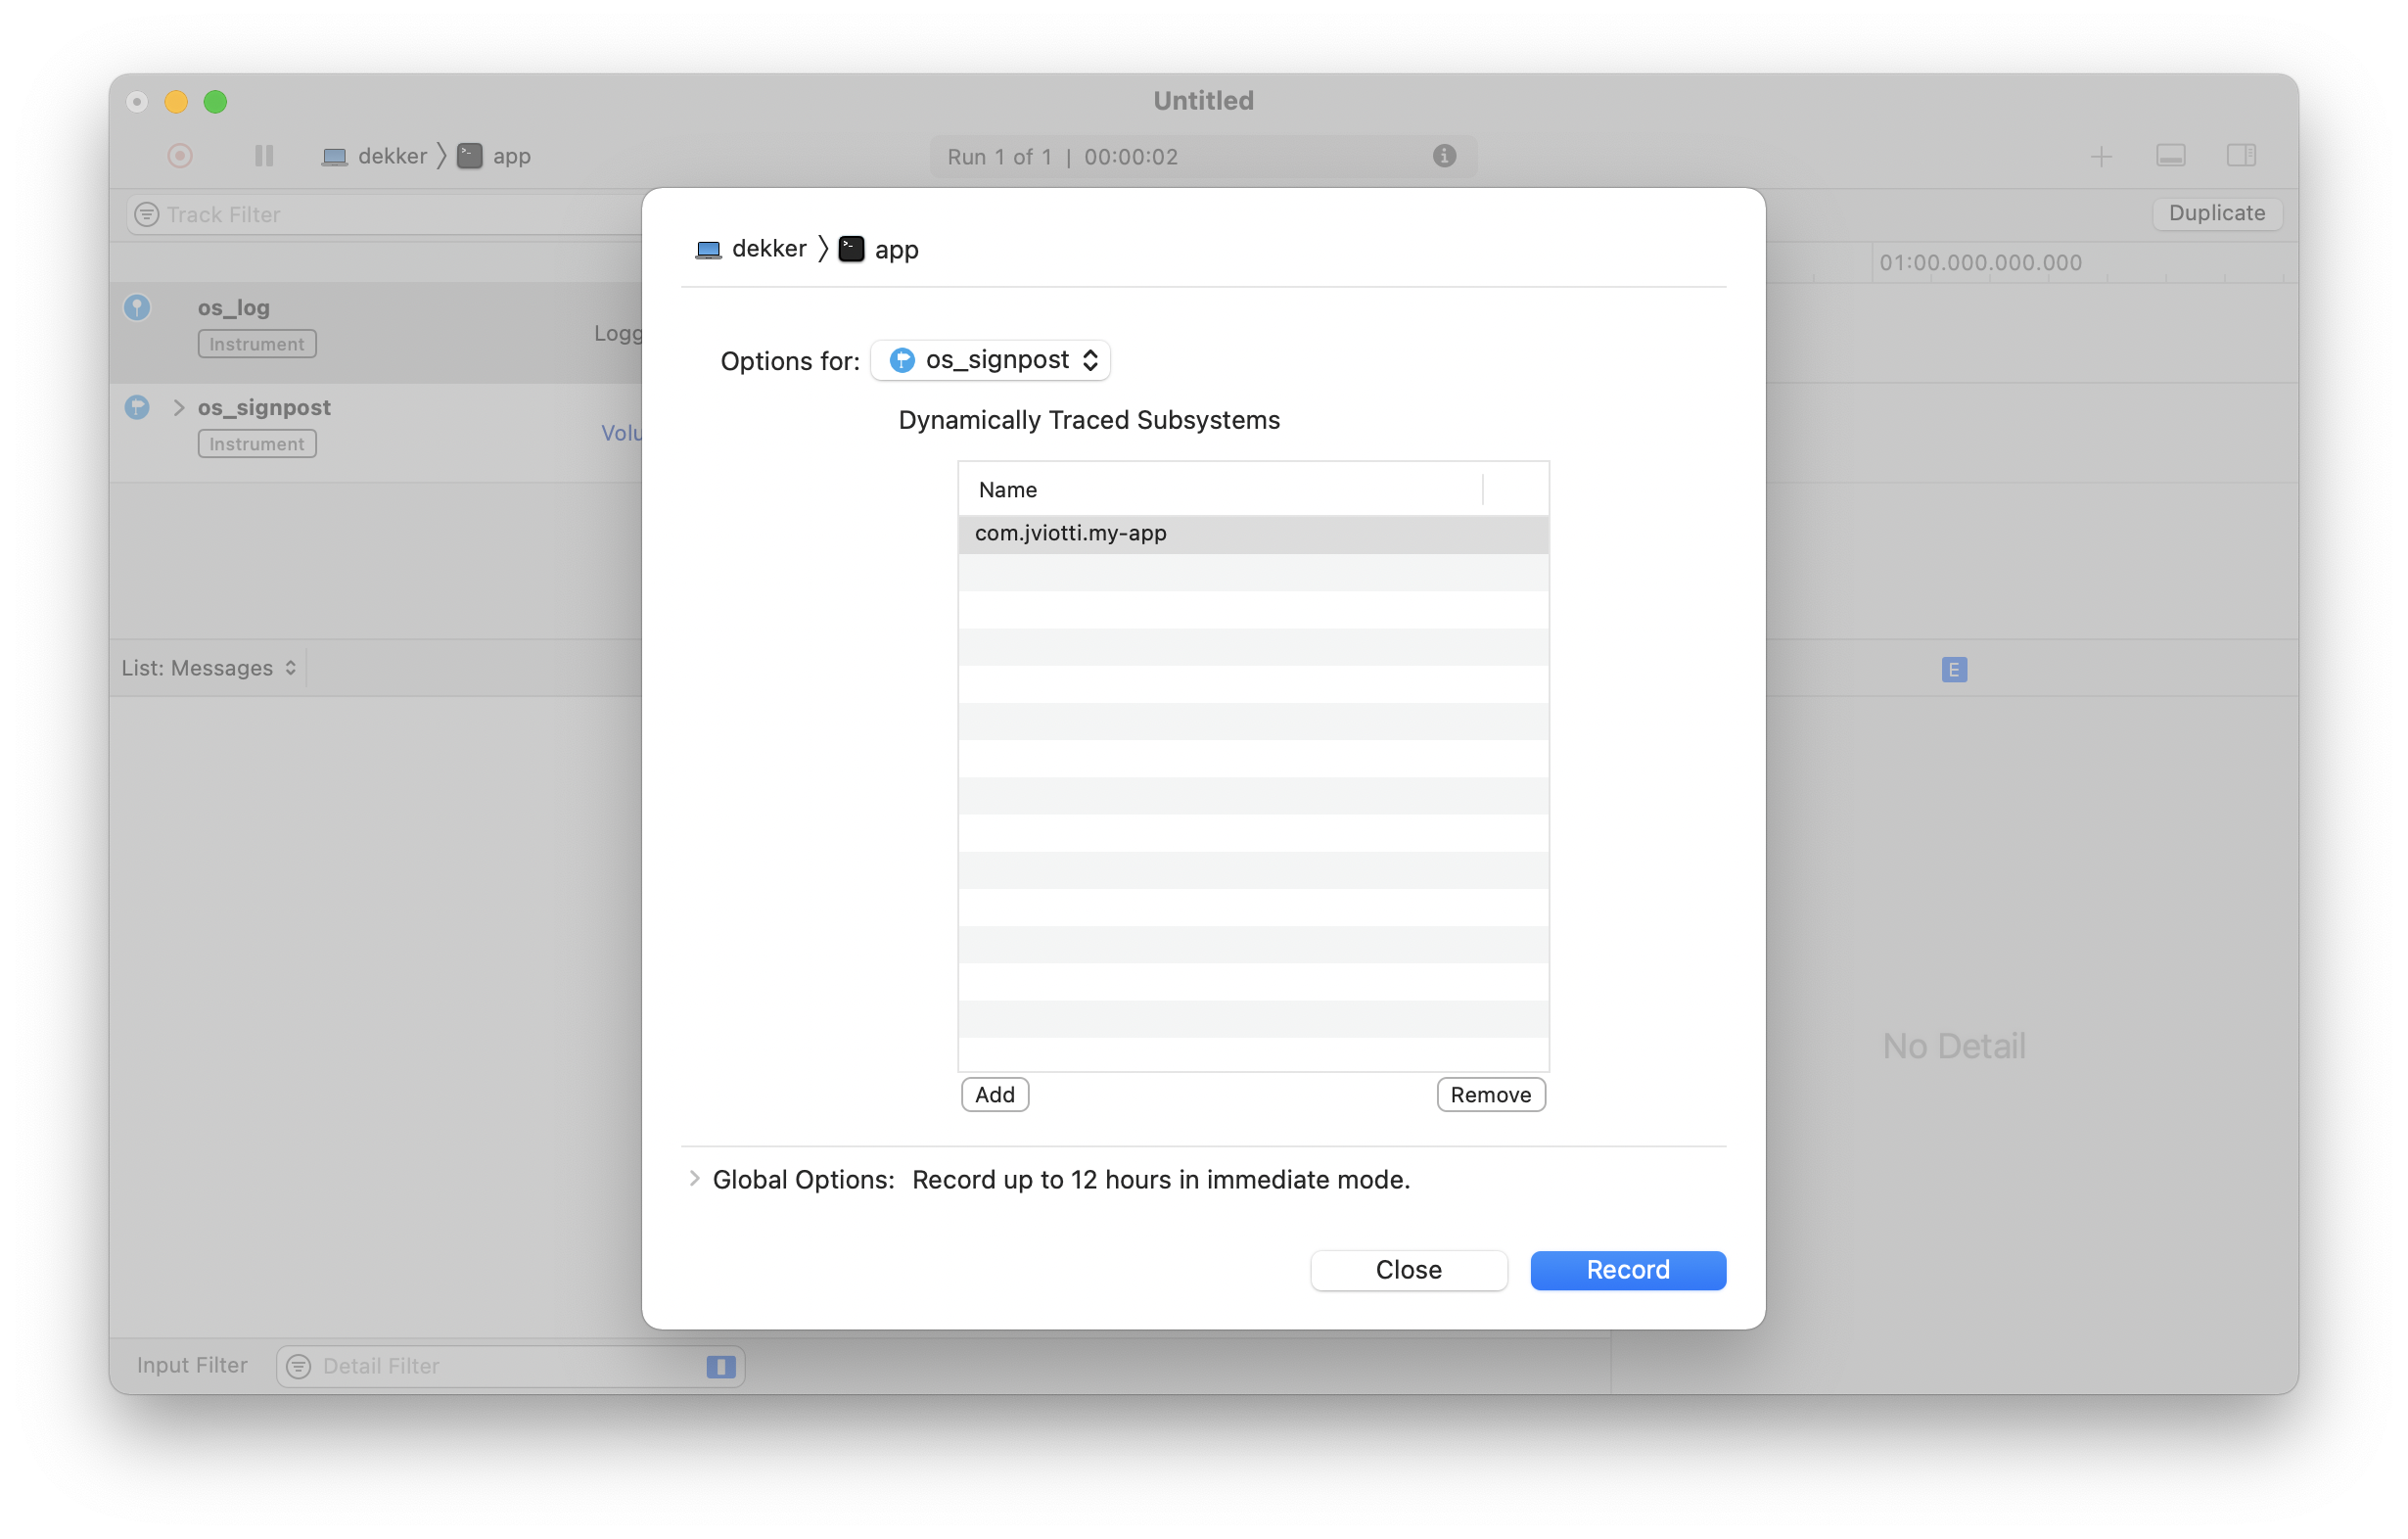
}We will compile the program with clang(1) as
before. However, xctrace(1) does not provide an
option to enable dynamic tracing from within the command-line.
Instead, we will open the Instruments app directly, select the
“Logging” instrument, select our example program, go to
File -> Recording Options, inspect the options
for os_signpost, and add our subsystem to the list
of dynamically traced subsystems as follows:
After tracing our program, we see our interval in the
“DynamicTracing” category. To see the details, switch to the
List: Intervals view.