Attaching LLDB to production Electron.js builds on macOS
TL;DR: This article describes how to use LLDB to debug production builds of Electron.js on macOS
Debugging native code from a development Electron.js build is easy and well documented. However, there are cases in which you might need to attach a debugger on a production build of Electron.js and see more than assembly instructions. This article describes how you can have a reasonably sane debugging session on macOS production Electron.js builds.
I’m running Electron.js v16.0.9 on Apple M1 with macOS 12.2.1, but the same instructions should apply to Intel macOS as long as you use the corresponding x64 binaries.
LLDB Without Debugging Symbols
If we attach lldb(1) on a production Electron.js
build, we won’t see more than assembly instructions. To see how
this looks like, let’s first download and extract Electron.js
v16.0.9:
curl --location --remote-name https://github.com/electron/electron/releases/download/v16.0.9/electron-v16.0.9-darwin-arm64.zip
unzip electron-v16.0.9-darwin-arm64.zip
Because this is a production build, there are not many
symbols we can attach a breakpoint on. For the sake of the
experiment, we can pick a symbol that Electron.js exposes on
production builds, like ElectronMain. This global
symbol is declared with default visibility in shell/app/electron_library_main.h
:
__attribute__((visibility("default"))) int ElectronMain(int argc, char* argv[]);The ElectronMain function is defined as part of
Electron Framework.framework. We can inspect that
such symbol is indeed available by taking a look at
Electron Framework using nm(1):
$ nm -gU Electron.app/Contents/Frameworks/Electron\ Framework.framework/Versions/A/Electron\ Framework | grep ElectronMain
0000000000018320 T _ElectronMain
Let’s start lldb(1), break on
ElectronMain, run the target and see what we
get:
(lldb) target create "Electron.app/Contents/MacOS/Electron"
Current executable set to '/Users/jviotti/Downloads/Electron.app/Contents/MacOS/Electron' (arm64).

(lldb) breakpoint set --name ElectronMain
Breakpoint 1: where = Electron Framework`ElectronMain, address = 0x0000000000018320

(lldb) run
Process 43720 launched: '/Users/jviotti/Downloads/Electron.app/Contents/MacOS/Electron' (arm64)
Process 43720 stopped
* thread #1, queue = 'com.apple.main-thread', stop reason = breakpoint 1.1
    frame #0: 0x00000001082cc320 Electron Framework`ElectronMain
Electron Framework`ElectronMain:
->  0x1082cc320 <+0>:  sub    sp, sp, #0xb0             ; =0xb0
    0x1082cc324 <+4>:  stp    x22, x21, [sp, #0x80]
    0x1082cc328 <+8>:  stp    x20, x19, [sp, #0x90]
    0x1082cc32c <+12>: stp    x29, x30, [sp, #0xa0]
Target 0: (Electron) stopped.
As expected, assembly instructions is all we get.
DWARF Debugging Symbols
On Apple platforms, debugging symbols come in two flavours:
Mach-O binaries may include debugging symbols in their symbol
tables (referred to as the Stabs debugging format) or split into
separate .dSYM files based on the DWARF debugging
data format.
Debugging symbols take significant space. For example, the
uncompressed Electron.js DWARF debugging symbols for v16.0.9
used in this article are over 4 GB. Therefore, shipping
production Electron.js builds with Stabs would not be ideal for
end-users. Instead, the Electron.js project publishes separate
DWARF-based debugging symbols as part of every official release.
These packages are suffixed with -dsym and must not
be confused with the -symbols packages Electron.js
also provides. The latter correspond to Breakpad symbols as
covered in a
previous post.
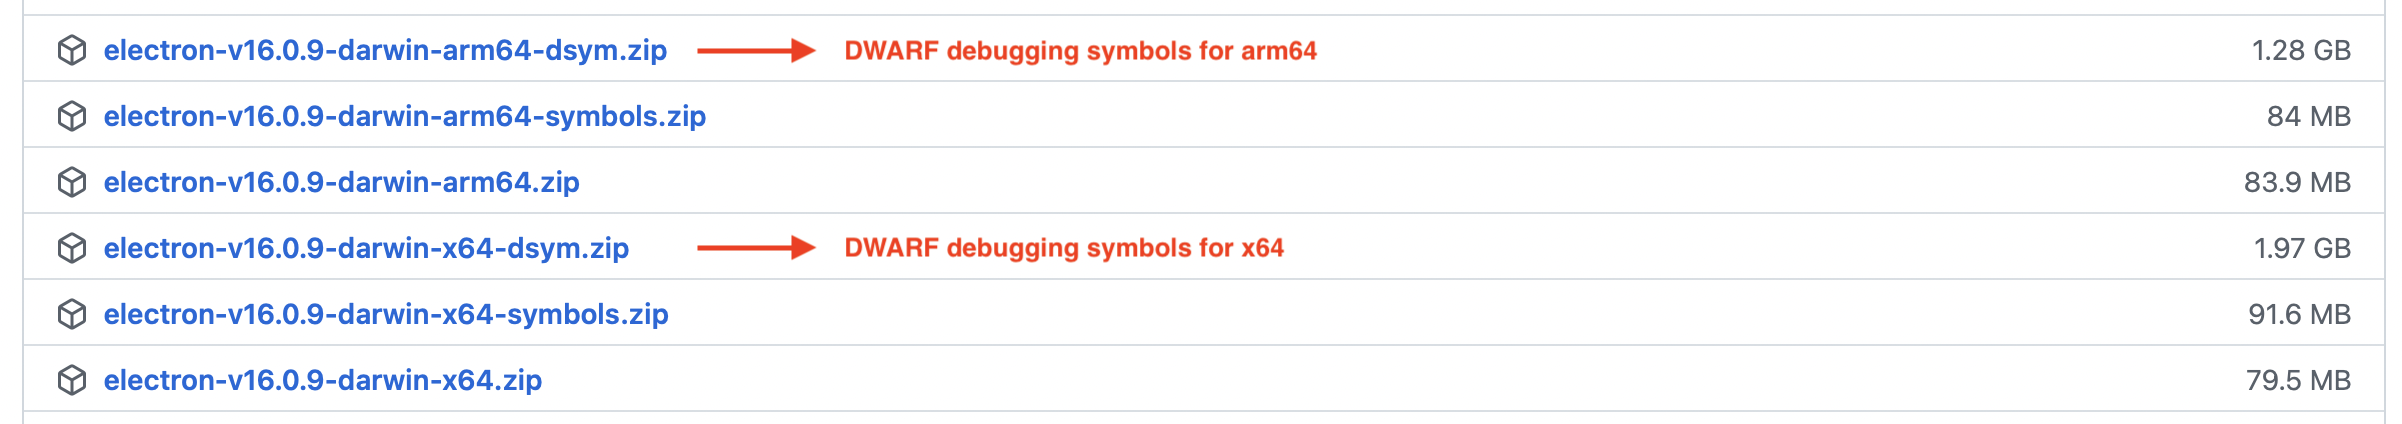
Let’s download and extract the debugging symbols associated with our version of Electron.js:
curl --location --remote-name https://github.com/electron/electron/releases/download/v16.0.9/electron-v16.0.9-darwin-arm64-dsym.zip
unzip electron-v16.0.9-darwin-arm64.zip -d symbols
The ZIP includes .dSYM folders that correspond
to the various Mach-O binaries that are included in the
Electron.js application bundle:
Electron Framework.dSYM/
Electron Helper (GPU).dSYM/
Electron Helper (Plugin).dSYM/
Electron Helper (Renderer).dSYM/
Electron Helper.dSYM/
Electron.dSYM/
Mantle.dSYM/
ReactiveObjC.dSYM/
ShipIt.dSYM/
Squirrel.dSYM/
chrome_crashpad_handler.dSYM/
libEGL.dylib.dSYM/
libGLESv2.dylib.dSYM/
libVkICD_mock_icd.dylib.dSYM/
libffmpeg.dylib.dSYM/
libswiftshader_libEGL.dylib.dSYM/
libswiftshader_libGLESv2.dylib.dSYM/
libvk_swiftshader.dylib.dSYM/
To prevent developers from accidentally loading debugging
symbols that do not match their corresponding targets, both the
DWARF file and its corresponding binary are tagged with a
LC_UUID Mach-O load command that consists of the
same UUID. It is important to confirm that you have the right
debugging symbols. If you don’t, lldb(1) will not
be able to associate them with your targets.
One way to cross-check the UUIDs is to directly inspect the
LC_UUID load commands using otool(1).
For example, we can validate
Electron Framework.framework against
Electron Framework.dSYM as follows:
$ otool -l Electron.app/Contents/Frameworks/Electron\ Framework.framework/Versions/A/Electron\ Framework
...
     cmd LC_UUID
 cmdsize 24
    uuid 4C4C4449-5555-3144-A12E-B47FF06382B1
...

$ otool -l symbols/Electron\ Framework.dSYM/Contents/Resources/DWARF/Electron\ Framework
...
     cmd LC_UUID
 cmdsize 24
    uuid 4C4C4449-5555-3144-A12E-B47FF06382B1
...
Alternatively, we can print the UUIDs directly using
dwarfdump(1):
$ dwarfdump -uuid Electron.app/Contents/Frameworks/Electron\ Framework.framework/Versions/A/Electron\ Framework
UUID: 4C4C4449-5555-3144-A12E-B47FF06382B1 (arm64) Electron.app/Contents/Frameworks/Electron Framework.framework/Versions/A/Electron Framework

$ dwarfdump -uuid symbols/Electron\ Framework.dSYM
UUID: 4C4C4449-5555-3144-A12E-B47FF06382B1 (arm64) symbols/Electron Framework.dSYM/Contents/Resources/DWARF/Electron Framework
Loading DWARF Symbols on LLDB
Debugging symbols can be loaded by using the
target symbols add command. For example, let’s
start lldb(1) on Electron.js and load the symbols
corresponding to Electron and
Electron Framework:
(lldb) target create "Electron.app/Contents/MacOS/Electron"
Current executable set to '/Users/jviotti/Downloads/Electron.app/Contents/MacOS/Electron' (arm64).
(lldb) target symbols add symbols/Electron.dSYM/
symbol file '/Users/jviotti/Downloads/symbols/Electron.dSYM/Contents/Resources/DWARF/Electron' has been added to '/Users/jviotti/Downloads/Electron.app/Contents/MacOS/Electron'
(lldb) target symbols add symbols/Electron\ Framework.dSYM/
symbol file '/Users/jviotti/Downloads/symbols/Electron Framework.dSYM/Contents/Resources/DWARF/Electron Framework' has been added to '/Users/jviotti/Downloads/Electron.app/Contents/Frameworks/Electron Framework.framework/Electron Framework'
We can see that lldb(1) reports that it
correctly associated our DWARF symbols with the corresponding
binaries. We can further confirm that the .dSYM
packages were associated correctly and print the matching UUIDs
by using image list:
(lldb) image list
[  0] 4C4C4473-5555-3144-A11C-BA3B9222E1BE 0x0000000100000000 /Users/jviotti/Downloads/Electron.app/Contents/MacOS/Electron
      /Users/jviotti/Downloads/symbols/Electron.dSYM/Contents/Resources/DWARF/Electron
...
[ 14] 4C4C4449-5555-3144-A12E-B47FF06382B1 0x0000000000000000 /Users/jviotti/Downloads/Electron.app/Contents/Frameworks/Electron Framework.framework/Electron Framework
      /Users/jviotti/Downloads/symbols/Electron Framework.dSYM/Contents/Resources/DWARF/Electron Framework
...
Instead of manually loading each .dSYM folder,
we should be able to enable external symbol lookup and add the
symbols directory to the search path as follows:
(lldb) settings set symbols.enable-external-lookup true
(lldb) settings set target.debug-file-search-paths /Users/jviotti/Downloads/symbols
However, for some reason I don’t understand,
lldb(1) doesn’t realize which symbols it should
load. Your mileage may vary!
Finding Available Symbols
Production Electron.js builds are compiled with optimizations
enabled. Therefore, not every symbol declared in the source code
will be available to break on. Compilers may inline, remove or
re-write certain functions. lldb(1) even warns
developers about this fact when setting a breakpoint on
Electron Framework:
Electron Framework was compiled with optimization - stepping may behave oddly; variables may not be available.One strategy to find out about the symbols that are still
available consists in taking a look at the corresponding DWARF
files using dwarfdump(1). While the output may be
overwhelming, skimming through it will quickly highlight several
available symbols. For example, here are some of the available
symbols I was able to quickly find on
Electron Framework:
$ dwarfdump --debug-info symbols/Electron\ Framework.dSYM
...
0x0003bc64:   DW_TAG_subprogram
                DW_AT_low_pc    (0x0000000000018320)
                DW_AT_high_pc   (0x00000000000183c8)
                DW_AT_frame_base        (DW_OP_reg29 W29)
                DW_AT_call_all_calls    (true)
                DW_AT_name      ("ElectronMain")
                DW_AT_decl_file ("/mnt/sfroot/_App/GomaWork/src/4527/Users/distiller/project/src/out/Default/../../electron/shell/app/electron_library_main.mm")
                DW_AT_decl_line (18)
                DW_AT_type      (0x0000000000038375 "int")
                DW_AT_external  (true)
                DW_AT_APPLE_optimized   (true)
...
0x0004378f:     DW_TAG_subprogram
                  DW_AT_low_pc  (0x0000000000018570)
                  DW_AT_high_pc (0x00000000000185b8)
                  DW_AT_frame_base      (DW_OP_reg29 W29)
                  DW_AT_call_all_calls  (true)
                  DW_AT_linkage_name    ("_ZN8electron16IsSandboxEnabledEPN4base11CommandLineE")
                  DW_AT_name    ("IsSandboxEnabled")
                  DW_AT_decl_file       ("/mnt/sfroot/_App/GomaWork/src/4695/Users/distiller/project/src/out/Default/../../electron/shell/app/command_line_args.cc")
                  DW_AT_decl_line       (58)
                  DW_AT_type    (0x0000000000041b8f "bool")
                  DW_AT_external        (true)
                  DW_AT_APPLE_optimized (true)
...
0x000444f5:       DW_TAG_subprogram
                    DW_AT_linkage_name  ("_ZN8electron12_GLOBAL__N_121ComputeBuiltInPluginsEPNSt3__16vectorIN7content16PepperPluginInfoENS1_9allocatorIS4_EEEE")
                    DW_AT_name  ("ComputeBuiltInPlugins")
                    DW_AT_decl_file     ("/mnt/sfroot/_App/GomaWork/src/4302/Users/distiller/project/src/out/Default/../../electron/shell/app/electron_content_client.cc")
                    DW_AT_decl_line     (105)
                    DW_AT_APPLE_optimized       (true)
                    DW_AT_inline        (DW_INL_inlined)
...
Normally, you will start a debugging session already knowing
what you want to break on. In those cases, you can check if the
symbol you are interested in is available using
image lookup:
(lldb) image lookup --name IsSandboxEnabled
1 match found in /Users/jviotti/Downloads/Electron.app/Contents/Frameworks/Electron Framework.framework/Electron Framework:
        Address: Electron Framework[0x0000000000018570] (Electron Framework.__TEXT.__text + 90864)
        Summary: Electron Framework`electron::IsSandboxEnabled(base::CommandLine*) at command_line_args.cc:58
In the above example, we located the
IsSandboxEnabled symbol, saw its declaration, and
the file and line number in which it was defined
(command_line_args.cc:58). Our debugging symbols
are working!
Configuring Source Maps
Debugging symbols associate addresses with human-friendly
locations in the source code, but do not embed the actual the
source code. Before we can set breakpoints, we need to tell
lldb(1) where to find the corresponding source code
that was used the produce the given build.
First of all, let’s download and extract the Electron.js v16.0.9 source code archive from GitHub. Cloning the repository and checking out the corresponding tag is equally valid:
curl --location --remote-name https://github.com/electron/electron/archive/refs/tags/v16.0.9.zip
unzip v16.0.9.zip
DWARF debugging symbols associate a symbol to the absolute path of its corresponding source code file as present in the computer that performed the compilation. To speed up compilation, Electron.js makes use of the Goma distributed compiler service. As a consequence of Goma’s distributed nature, the absolute path to the source code file where the compilation originally took place tends to vary across compilation units.
We can inspect the absolute path associated with a given
symbol using image lookup and its
--verbose flag. For example, the absolute path to
the source code associated with some of the symbols we
previously looked at have different Goma-related base
directories:
(lldb) image lookup --verbose --name ElectronMain
...
    CompileUnit: id = {0x00000023}, file = "/mnt/sfroot/_App/GomaWork/src/4527/Users/distiller/project/src/electron/shell/app/electron_library_main.mm", language = "objective-c++"
...

(lldb) image lookup --verbose --name IsSandboxEnabled
...
    CompileUnit: id = {0x00000024}, file = "/mnt/sfroot/_App/GomaWork/src/4695/Users/distiller/project/src/electron/shell/app/command_line_args.cc", language = "c++14"
...

(lldb) image lookup --verbose --name ComputeBuiltInPlugins
...
    CompileUnit: id = {0x00000025}, file = "/mnt/sfroot/_App/GomaWork/src/4302/Users/distiller/project/src/electron/shell/app/electron_content_client.cc", language = "c++14"
...
The target.source-map setting consist of a
sequence of pairs that allows us to re-map the base directories
of the original source files to a base directory of our own.
For example, we can map
/mnt/sfroot/_App/GomaWork/src/4527/Users/distiller/project/src/electron
to our local Electron.js source code as follows:
(lldb) settings set target.source-map /mnt/sfroot/_App/GomaWork/src/4527/Users/distiller/project/src/electron /Users/jviotti/Downloads/electron-16.0.9Settings Breakpoints
At this point, we are in a position to set breakpoints on our
production Electron.js build and resolve symbols correctly.
Given what we have learnt, let’s set a breakpoint on
ElectronMain:
(lldb) target create "Electron.app/Contents/MacOS/Electron"
Current executable set to '/Users/jviotti/Downloads/Electron.app/Contents/MacOS/Electron' (arm64).

(lldb) target symbols add /Users/jviotti/Downloads/symbols/Electron\ Framework.dSYM
symbol file '/Users/jviotti/Downloads/symbols/Electron Framework.dSYM/Contents/Resources/DWARF/Electron Framework' has been added to '/Users/jviotti/Downloads/Electron.app/Contents/Frameworks/Electron Framework.framework/Electron Framework'

(lldb) image lookup --verbose --name ElectronMain
...
    CompileUnit: id = {0x00000023}, file = "/mnt/sfroot/_App/GomaWork/src/4527/Users/distiller/project/src/electron/shell/app/electron_library_main.mm", language = "objective-c++"
...

(lldb) settings set target.source-map /mnt/sfroot/_App/GomaWork/src/4527/Users/distiller/project/src/electron /Users/jviotti/Downloads/electron-16.0.9

(lldb) breakpoint set --name ElectronMain
Breakpoint 1: where = Electron Framework`ElectronMain + 32 at electron_library_main.mm:19:34, address = 0x0000000000018340
Optimization-related warnings aside, hitting run
will present us with source code that we can inspect as
usual:
(lldb) run
Process 69574 launched: '/Users/jviotti/Downloads/Electron.app/Contents/MacOS/Electron' (arm64)
Electron Framework was compiled with optimization - stepping may behave oddly; variables may not be available.
Process 69574 stopped
* thread #1, queue = 'com.apple.main-thread', stop reason = breakpoint 1.1
    frame #0: 0x00000001082cc340 Electron Framework`ElectronMain(argc=1, argv=0x000000016fdff0f0) at electron_library_main.mm:19:34 [opt]
   16   #include "shell/common/mac/main_application_bundle.h"
   17
   18   int ElectronMain(int argc, char* argv[]) {
-> 19     electron::ElectronMainDelegate delegate;
   20     content::ContentMainParams params(&delegate);
   21     params.argc = argc;
   22     params.argv = const_cast<const char**>(argv);
Target 0: (Electron) stopped.
However, stepping into a function defined as part of another
compilation unit, like
electron::ElectronCommandLine::Init which is called
by ElectronMain a couple of statements afterwards,
will take us back to square one again:
Process 69574 stopped
* thread #1, queue = 'com.apple.main-thread', stop reason = step over
    frame #0: 0x00000001082cc37c Electron Framework`ElectronMain(argc=1, argv=0x000000016fdff0f0) at electron_library_main.mm:23:3 [opt]
   20     content::ContentMainParams params(&delegate);
   21     params.argc = argc;
   22     params.argv = const_cast<const char**>(argv);
-> 23     electron::ElectronCommandLine::Init(argc, argv);
   24     return content::ContentMain(params);
   25   }
   26
Target 0: (Electron) stopped.

(lldb) step
Process 69574 stopped
* thread #1, queue = 'com.apple.main-thread', stop reason = step in
    frame #0: 0x0000000108409b94 Electron Framework`electron::ElectronCommandLine::Init(argc=1, argv=0x000000016fdff0f0) at electron_command_line.cc:23:10 [opt]
Target 0: (Electron) stopped.
We know that because of Goma,
electron_command_line.cc is probably recorded under
a different base directory. To keep going, we can inspect
electron::ElectronCommandLine::Init with
image lookup and re-adjust
target.source-map:
(lldb) image lookup --verbose --name electron::ElectronCommandLine::Init
...
    CompileUnit: id = {0x000000bd}, file = "/mnt/sfroot/_App/GomaWork/src/4601/Users/distiller/project/src/electron/shell/common/electron_command_line.cc", language = "c++14"
...

(lldb) settings set target.source-map /mnt/sfroot/_App/GomaWork/src/4601/Users/distiller/project/src/electron /Users/jviotti/Downloads/electron-16.0.9

(lldb) frame select
frame #0: 0x0000000108409b94 Electron Framework`electron::ElectronCommandLine::Init(argc=1, argv=0x000000016fdff0f0) at electron_command_line.cc:23:10 [opt]
   20     // Otherwise we'd have to convert the arguments from UTF16.
   21   #if !defined(OS_WIN)
   22     // Hack around with the argv pointer. Used for process.title = "blah"
-> 23     argv = uv_setup_args(argc, argv);
   24   #endif
   25
   26     argv_.assign(argv, argv + argc);