Debugging Electron.js native crashes on macOS
TL;DR: This article describes in detail how to symbolicalize Electron.js native crashes on macOS
This article aims to explain how to debug a macOS native crash on a release build of Electron.js. In the case of macOS, this is usually a crash coming from the C++ or Objective-C++ parts of Electron.js, Chromium or Node.js. If you maintain a production desktop application built using Electron.js, a user will report a native crash sooner or later, and it helps to be prepared for it.
This article is based on Electron.js v16.0.4 arm64 running on macOS Monterey.
See Debugging Electron.js native crashes on GNU/Linux for a GNU/Linux adaptation of this post.
Introducing Chromium’s Breakpad and Crashpad
Chromium maintains a cross-platform open-source crash-reporting system called Breakpad written in C++ and Objective-C++. The Breakpad client library provides functionality to monitor the application for unhandled exceptions, generating dumps and optionally upload them to Breakpad’s own open-source server or Breakpad-aware third-party error reporting servers such as Sentry and Mozilla’s Socorro. Chromium also maintains Crashpad, which is meant to be the eventual successor of Breakpad. Both Crashpad and Breakpad emit dumps using the same format. At the time of this writing, Electron.js uses Crashpad on macOS and Windows and Breakpad on GNU/Linux.
When an unhandled exception occurs, both Breakpad and Crashpad generate a dump using Microsoft’s minidump format. For uniformity and space-efficiency reasons, this Microsoft-specific dump format is used in all the supported platforms, not only for Windows. You can read more about minidump files here.
Using the
crashReporter Electron.js module
Electron.js offers the crashReporter
module to interact with Breakpad and Crashpad from the
main Electron.js process using JavaScript. It is
essential for any production-ready Electron.js application to
start the Breakpad client as early as possible during the
application startup logic. Otherwise, no dump will be
generated if a crash occurs. For example, you can setup
crashReporter to generate local-only dumps as
follows:
import { crashReporter, app } from 'electron';
crashReporter.start({ uploadToServer: false });
console.error('Storing dumps inside', app.getPath('crashDumps'));
The resulting dumps, if any, will be stored at the path
determined by the configurable crashDumps
setting. By default, this path equals
$HOME/Library/Application Support/<app name>/Crashpad
for macOS.
Fetching Breakpad symbols
The Electron.js release builds that are typically downloaded from GitHub Releases do not include debugging symbols. Therefore, a dump originating from one of such release builds omits human-readable information such as symbol names, file names and line numbers. To simplify the debugging process, developers augment the dump with human-readable information in the form of Breakpad symbol files. Electron.js publishes Breakpad symbols for every official release on GitHub Releases.
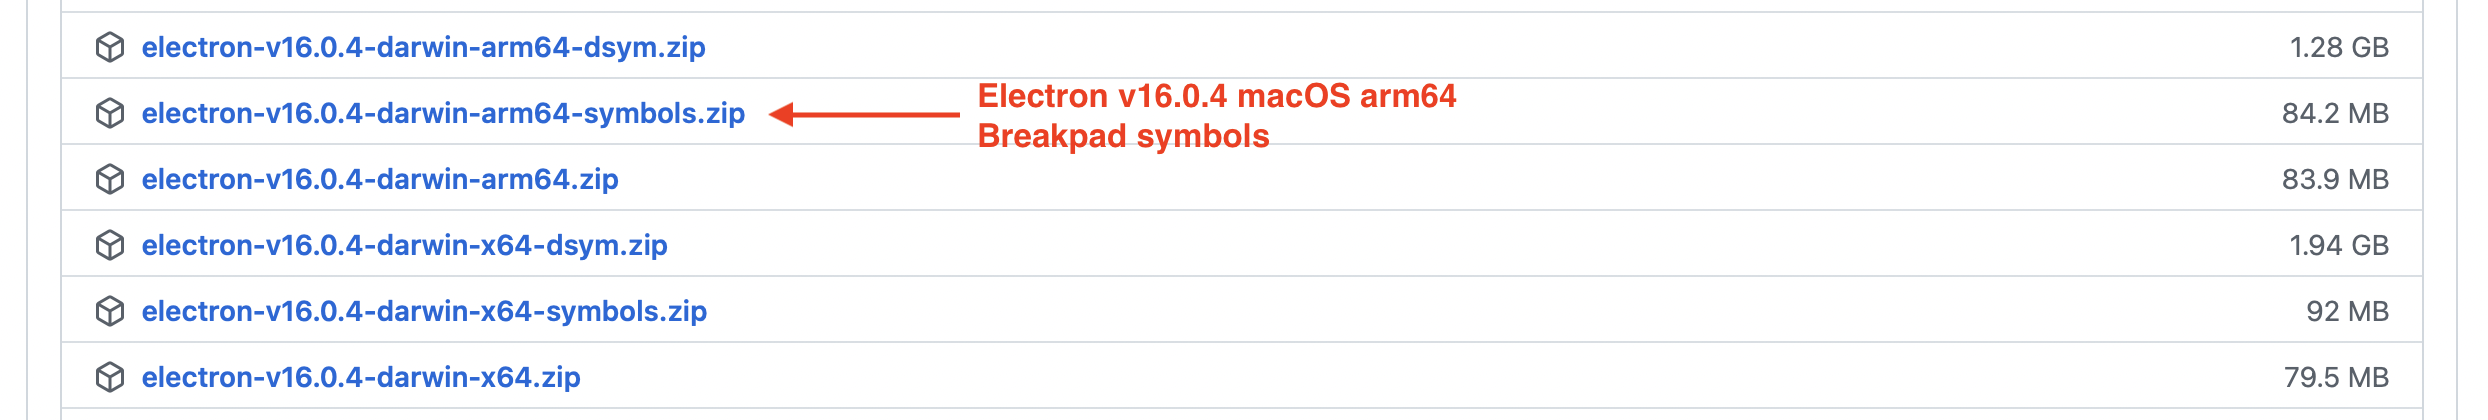
We are running Electron.js v16.0.4 arm64 for macOS, so we would download electron-v16.0.4-darwin-arm64-symbols.zip from the v16.0.4 release:
It is crucial to use the Breakpad symbols that were extracted when compiling the precise release build of Electron.js that the application is running. Electron.js builds are not deterministic. Therefore, the same Breakpad symbols cannot be used by two Electron.js builds produced out of the exact same source tree and with the same build arguments.
Parsing a dump with the incorrect Breakpad symbols is worse than having no symbols on the first place!
These are the contents of the Electron.js v16.0.4 macOS arm64
symbols ZIP archive. The directory in which we are interested in
is breakpad_symbols, which contains *.sym
files that describe each Mach-O file in the Electron.js
bundle:
electron-v16.0.4-darwin-arm64-symbols
├── LICENSE
├── LICENSES.chromium.html
├── breakpad_symbols
│   ├── Electron
│   │   └── 4C4C443655553144A1977E62CFD231670
│   │       └── Electron.sym
│   ├── Electron\ Framework
│   │   └── 4C4C449C55553144A1BC79C29F1D7B510
│   │       └── Electron\ Framework.sym
│   ├── Electron\ Helper
│   │   └── 4C4C449855553144A1DA5AA440102B040
│   │       └── Electron\ Helper.sym
│   ├── Electron\ Helper\ (GPU)
│   │   └── 4C4C44D955553144A1E0645984EBAE370
│   │       └── Electron\ Helper\ (GPU).sym
│   ├── Electron\ Helper\ (Plugin)
│   │   └── 4C4C447955553144A14F6931A6049BB90
│   │       └── Electron\ Helper\ (Plugin).sym
│   ├── Electron\ Helper\ (Renderer)
│   │   └── 4C4C444255553144A1918E8EC8D45D2D0
│   │       └── Electron\ Helper\ (Renderer).sym
│   ├── chrome_crashpad_handler
│   │   └── 4C4C449955553144A1D3B68D34B0AB030
│   │       └── chrome_crashpad_handler.sym
│   ├── libswiftshader_libEGL.dylib
│   │   └── 4C4C44C555553144A1A7A4E67FB572F50
│   │       └── libswiftshader_libEGL.dylib.sym
│   └── libswiftshader_libGLESv2.dylib
│       └── 4C4C44E655553144A1ACBFB2F48BF48D0
│           └── libswiftshader_libGLESv2.dylib.sym
└── version

19 directories, 12 files
Extracting symbols from custom Electron.js builds
As explained previously, Breakpad symbols can only be used to augment dumps produced by the exact binaries that the symbols have been extracted from. It follows that it is not possible to make use of the Breakpad symbols published for the official Electron.js releases for a custom build of Electron.js. If you are building Electron.js from source, then you also need to extract the Breakpad symbols from your build as the official Electron.js builds do and store them somewhere you can reference them later.
To accomplish this, Electron.js provides a Ninja target that
makes use of the dump_syms tool distributed by
Breakpad to extract the symbols from the various Mach-O files
included in the resulting Electron.js bundle:
# (1) Extract Breakpad symbols
$ ninja -C src/out/<profile> electron:electron_symbols

# (2) Create a ZIP containing the Breakpad symbols
$ python3 src/electron/script/zip-symbols.py -b src/out/<profile>
The resulting ZIP is located at
src/out/<profile>/symbols.zip.
Using
minidump_stackwalk
The Breakpad project also ships with a command-line tool
named minidump_stackwalk to analyze minidump files,
augment them with the Breakpad symbols obtained before and
convert the dumps into human-readable stack-traces.
One way to install minidump_stackwalk is to
build Breakpad from source as explained in the documentation:
# (1) Clone depot_tools and add it to the PATH
$ git clone https://chromium.googlesource.com/chromium/tools/depot_tools.git
$ export PATH="$(pwd)/depot_tools:$PATH"

# (2) Clone Breakpad and its dependencies
$ mkdir breakpad && cd breakpad
$ fetch breakpad && cd src

# (3) Build Breakpad from source
$ ./configure && make

# minidump_stackwalk is located in src/processor
$ file src/processor/minidump_stackwalk
src/processor/minidump_stackwalk: Mach-O 64-bit executable arm64
However, if you are building Electron.js from source, then
Breakpad is already available at
src/third_party/breakpad. The
minidump_stackwalk tool can be compiled from an
existing Electron.js checkout as follows:
$ ninja -C src/out/<profile> third_party/breakpad:minidump_stackwalk
$ file src/out/<profile>/minidump_stackwalk
src/out/<profile>/minidump_stackwalk: Mach-O 64-bit executable arm64
The minidump_stackwalk tool takes a path to a
minidump file as the first positional argument and one or more
paths that include Breakpad symbols. For example:
$ ./path/to/minidump_stackwalk path/to/dump.dmp path/to/breakpad_symbolsPutting it into practice
In the context of Electron.js, we can use the process.crash()
JavaScript function in the main process to cause a native crash.
However, to make the example more interesting, we will
artificially cause the official Electron.js macOS arm64 v16.0.4
release build to crash by deleting the renderer process helper
binary from the application bundle:
$ rm Electron.app/Contents/Frameworks/Electron Helper (Renderer).app/Contents/MacOS/Electron Helper (Renderer)The default
application distributed by the official Electron.js release
builds at
Electron.app/Contents/Resources/default_app.asar
does not start the crash reporter. In order to produce local
dumps, we extend the default application code to start the crashReporter
module as explained previously:
diff --git a/default_app/main.ts b/default_app/main.ts
index c1b309170..1ec2c1c0b 100644
--- a/default_app/main.ts
+++ b/default_app/main.ts
@@ -3,7 +3,9 @@ import * as electron from 'electron';
 import * as fs from 'fs';
 import * as path from 'path';
 import * as url from 'url';
-const { app, dialog } = electron;
+const { app, dialog, crashReporter } = electron;
+
+crashReporter.start({ uploadToServer: false });

 type DefaultAppOptions = {
   file: null | string;
If you have a local Electron.js checkout, you can apply the
above patch, re-build the application and replace the default_app.asar
archive on the release build as follows:
# (1) Apply the patch described above
$ patch --directory src/electron --strip 1 < path/to/patch

# (2) Rebuild the default application
$ ninja -C src/out/<profile> electron:default_app_asar

# (3) Copy the new default application into the release build
$ cp src/out/<profile>/resources/default_app.asar \
  path/to/Electron.app/Contents/Resources/default_app.asar
Running the application using the entry-point of the bundle
results in a crash, as expected. The crash_report_exception_handler.cc
file mention comes from Crashpad’s macOS exception handler,
proving that Crashpad is catching the exception:
$ ./Electron.app/Contents/MacOS/Electron
...
[1203/130625.741605:WARNING:crash_report_exception_handler.cc(240)] UniversalExceptionRaise: (os/kern) failure (5)
[28589:1203/130625.743433:ERROR:child_thread_impl.cc(231)] Invalid PlatformChannel receive right
Once the application exits, a dump file is created at
$HOME/Library/Application Support/Electron/Crashpad:
$ tree "$HOME/Library/Application Support/Electron/Crashpad"
├── completed
│   └── aa3104bd-a744-4a14-b54c-15a369fae0f0.dmp
├── new
├── pending
└── settings.dat

3 directories, 2 files

$ cd "$HOME/Library/Application Support/Electron/Crashpad/completed"
$ file aa3104bd-a744-4a14-b54c-15a369fae0f0.dmp
aa3104bd-a744-4a14-b54c-15a369fae0f0.dmp: Mini DuMP crash report, 7 streams, Fri Dec  3 12:10:06 2021, 0x0 type
Next, we will inspect this minidump file using
minidump_stackwalk and the Breakpad symbols
corresponding to our official Electron.js build: electron-v16.0.4-darwin-arm64-symbols.zip:
# (1) Download and extract the Breakpad symbols
$ curl --location --output electron-v16.0.4-darwin-arm64-symbols.zip \
  https://github.com/electron/electron/releases/download/v16.0.4/electron-v16.0.4-darwin-arm64-symbols.zip
$ unzip electron-v16.0.4-darwin-arm64-symbols.zip -d electron-v16.0.4-darwin-arm64-symbols

# (2) Convert the dump into a human-readable stack-trace
$ ./path/to/minidump_stackwalk \
  "$HOME/Library/Application Support/Electron/Crashpad/completed/aa3104bd-a744-4a14-b54c-15a369fae0f0.dmp"
  electron-v16.0.4-darwin-arm64-symbols/breakpad_symbols
The minidump_stackwalk tool produces significant
debugging output. However, these are the key highlights for this
case:
...
Crash reason:  EXC_BREAKPOINT / 0x00000001
Crash address: 0x10a4b7b58
Process uptime: 0 seconds

Thread 0 (crashed)
 0  Electron Framework!electron::ElectronBrowserClient::AppendExtraCommandLineSwitches(base::CommandLine*, int) [electron_browser_client.cc : 526 + 0x0]
 ...
 1  Electron Framework!electron::ElectronBrowserClient::AppendExtraCommandLineSwitches(base::CommandLine*, int) [electron_browser_client.cc : 526 + 0x8]
 ...
 2  Electron Framework!content::RenderProcessHostImpl::AppendRendererCommandLine(base::CommandLine*) [render_process_host_impl.cc : 3362 + 0x10]
 ...
 3  Electron Framework!content::RenderProcessHostImpl::Init() [render_process_host_impl.cc : 1969 + 0x8]
 ...
 4  Electron Framework!content::RenderFrameHostManager::ReinitializeMainRenderFrame(content::RenderFrameHostImpl*) [render_frame_host_manager.cc : 2979 + 0x0]
 ...
It is clear from the stack-trace that there is an issue when
spawning the renderer process through the command-line. The
crash occurs in the main process, when executing code from the
Electron Framework.framework
bundle. The top entry of the stack points at line number 526 of
the AppendExtraCommandLineSwitches function defined
in electron_browser_client.cc:
CHECK_EQ(program, child_path)
    << "Aborted from launching unexpected helper executable";
The problem becomes clearer if we inspect the values of
program and child_path before such
equality check:
...
    base::FilePath child_path;
    base::FilePath program =
        base::MakeAbsoluteFilePath(command_line->GetProgram());
...
    if (program != renderer_child_path && program != gpu_child_path
#if BUILDFLAG(ENABLE_PLUGINS)
        && program != plugin_child_path
#endif
    ) {
      child_path = content::ChildProcessHost::GetChildPath(
          content::ChildProcessHost::CHILD_NORMAL);
      CHECK_EQ(program, child_path)
          << "Aborted from launching unexpected helper executable";
    }
...
We can see that program is assigned to the
result of base::MakeAbsoluteFilePath and
child_path is assigned to the result of
content::ChildProcessHost::GetChildPath. Both of
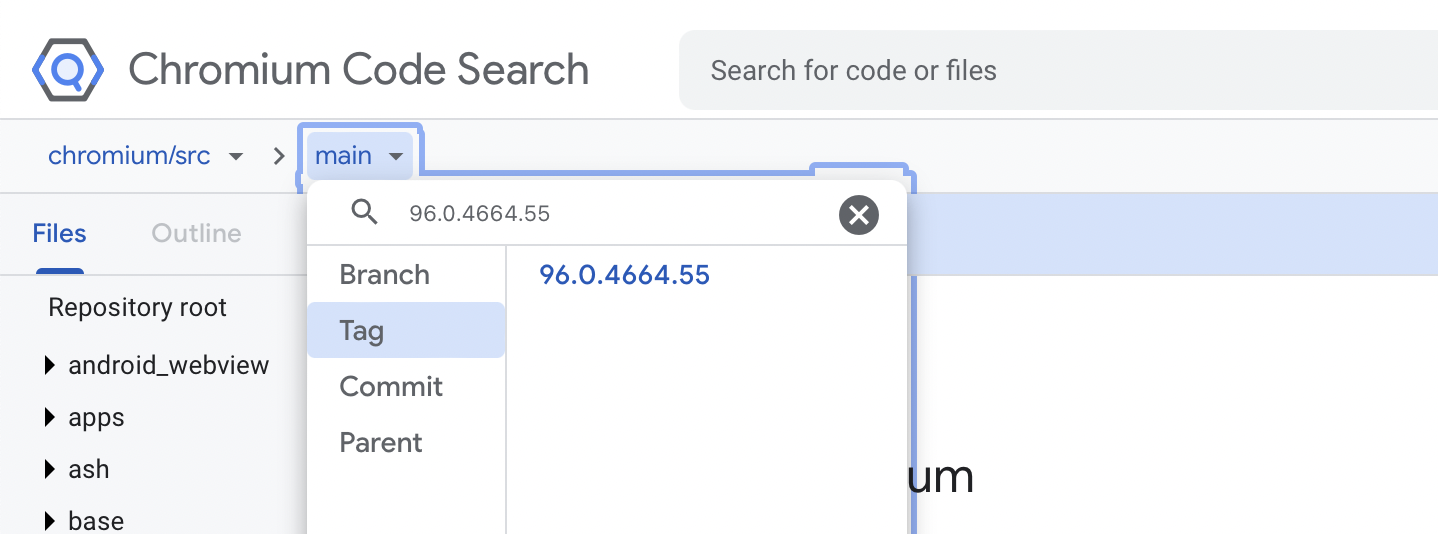
these functions are defined in Chromium. The DEPS
file of Electron.js declares that v16.0.4 depends on Chromium
96.0.4664.55. An easy way to inspect Chromium’s source code is
to use the online Chromium
Code Search web-app. We can select the Chromium version we
want to inspect at the top left part of the screen:
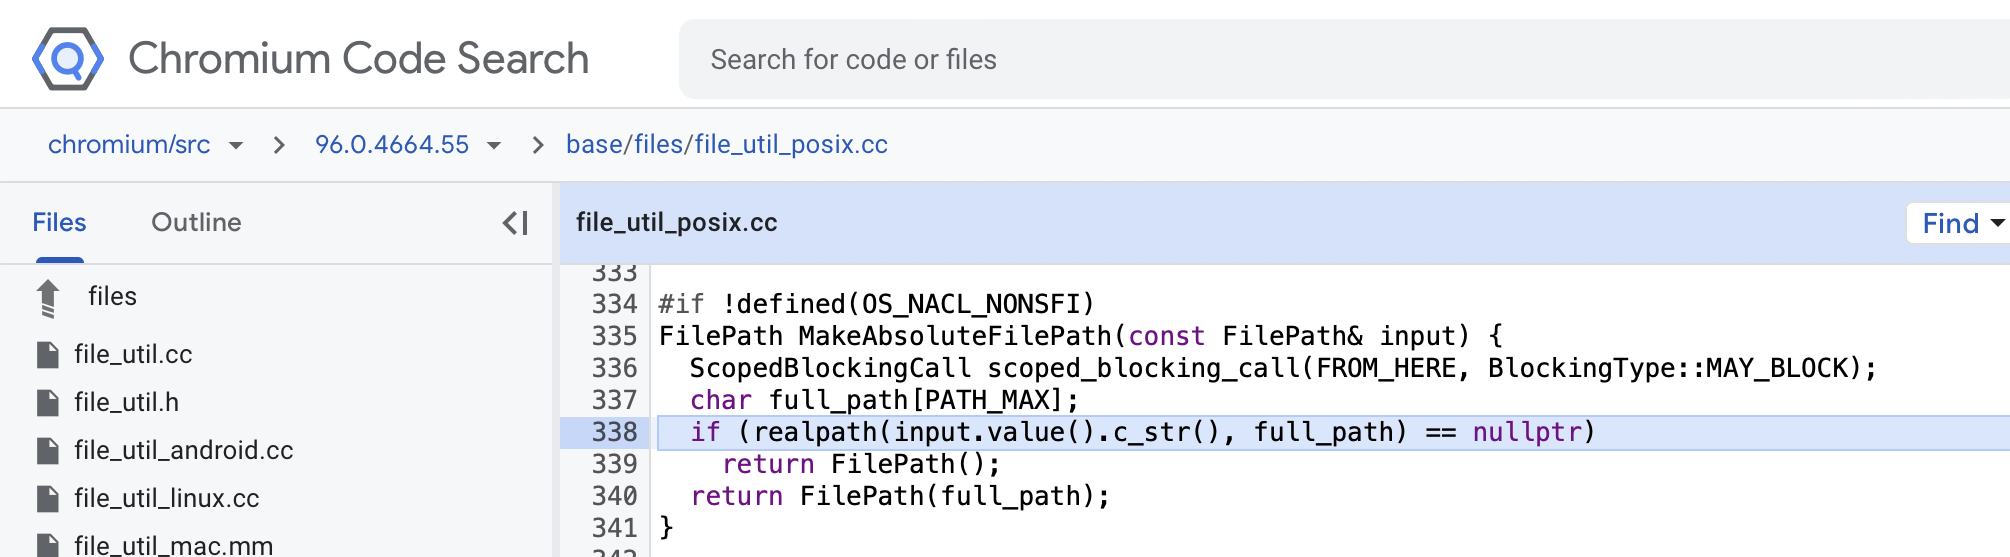
The key to the mystery is base::MakeAbsoluteFilePath.
This function takes a file path (the path to the renderer
process helper program in this case) and resolves it as an
absolute path using the realpath(3)
function from the C standard library:
According to the documentation:
The
realpath()function will resolve both absolute and relative paths and return the absolute pathname corresponding tofile_name. All components of file_name must exist whenrealpath()is called. […] If an error occurs,realpath()returnsNULLandresolved_namecontains the pathname which caused the problem.
If the input file passed to
base::MakeAbsoluteFilePath does not exist (like in
our case), realpath() returns NULL and
base::MakeAbsoluteFilePath returns an empty file
path that will always fail the CHECK_EQ
assertion.
It would have been extremely difficult to pin-point the problem without a human-readable stack-trace!