Debugging MSVC C++ crashes from the terminal using CDB
TL;DR: A high-level introduction to using the CDB command-line debugger in the context of C++ programs
A good part of my daily work revolves around maintaining a few cross-platform C++ libraries for working with JSON (such as JSON Toolkit and JSON BinPack) that come with first-class support for the MSVC (Microsoft Visual C++) compiler.
On Windows, my C++ debugging workflow historically consisted in opening the projects generated by CMake using the Visual Studio application, and clicking my way through to run targets with the built-in debugger. Whereas in other platforms, my workflow is quite terminal-heavy, involving tools such as vim, tmux, and LLDB.
This article is a brief introduction on how I lately adopted a command-line-first C++ debugging workflow on Windows using the CDB debugger. It is hopefully useful to macOS, GNU/Linux, or BSD developers that want a more familiar debugging experience on Windows.
Disclaimer: I’m typically not a Windows user. If you are one and spot any mistakes, or know how I could do things better, please let me know! I would love to level up my Windows skills.
Installing CDB
The Microsoft Console Debugger (CDB) is a command-line front-end to the well-known WinDbg debugging subsystem that ships as part of the Debugging Tools for Windows suite. This suite is not distributed directly, but as a component of either the Windows Driver Kit (WDK) or the Windows SDK (when selecting the Debugging Tools for Windows component). Instead of setting it up directly, I personally find it convenient to manage it as part of the Windows SDK component during a Visual Studio installation.
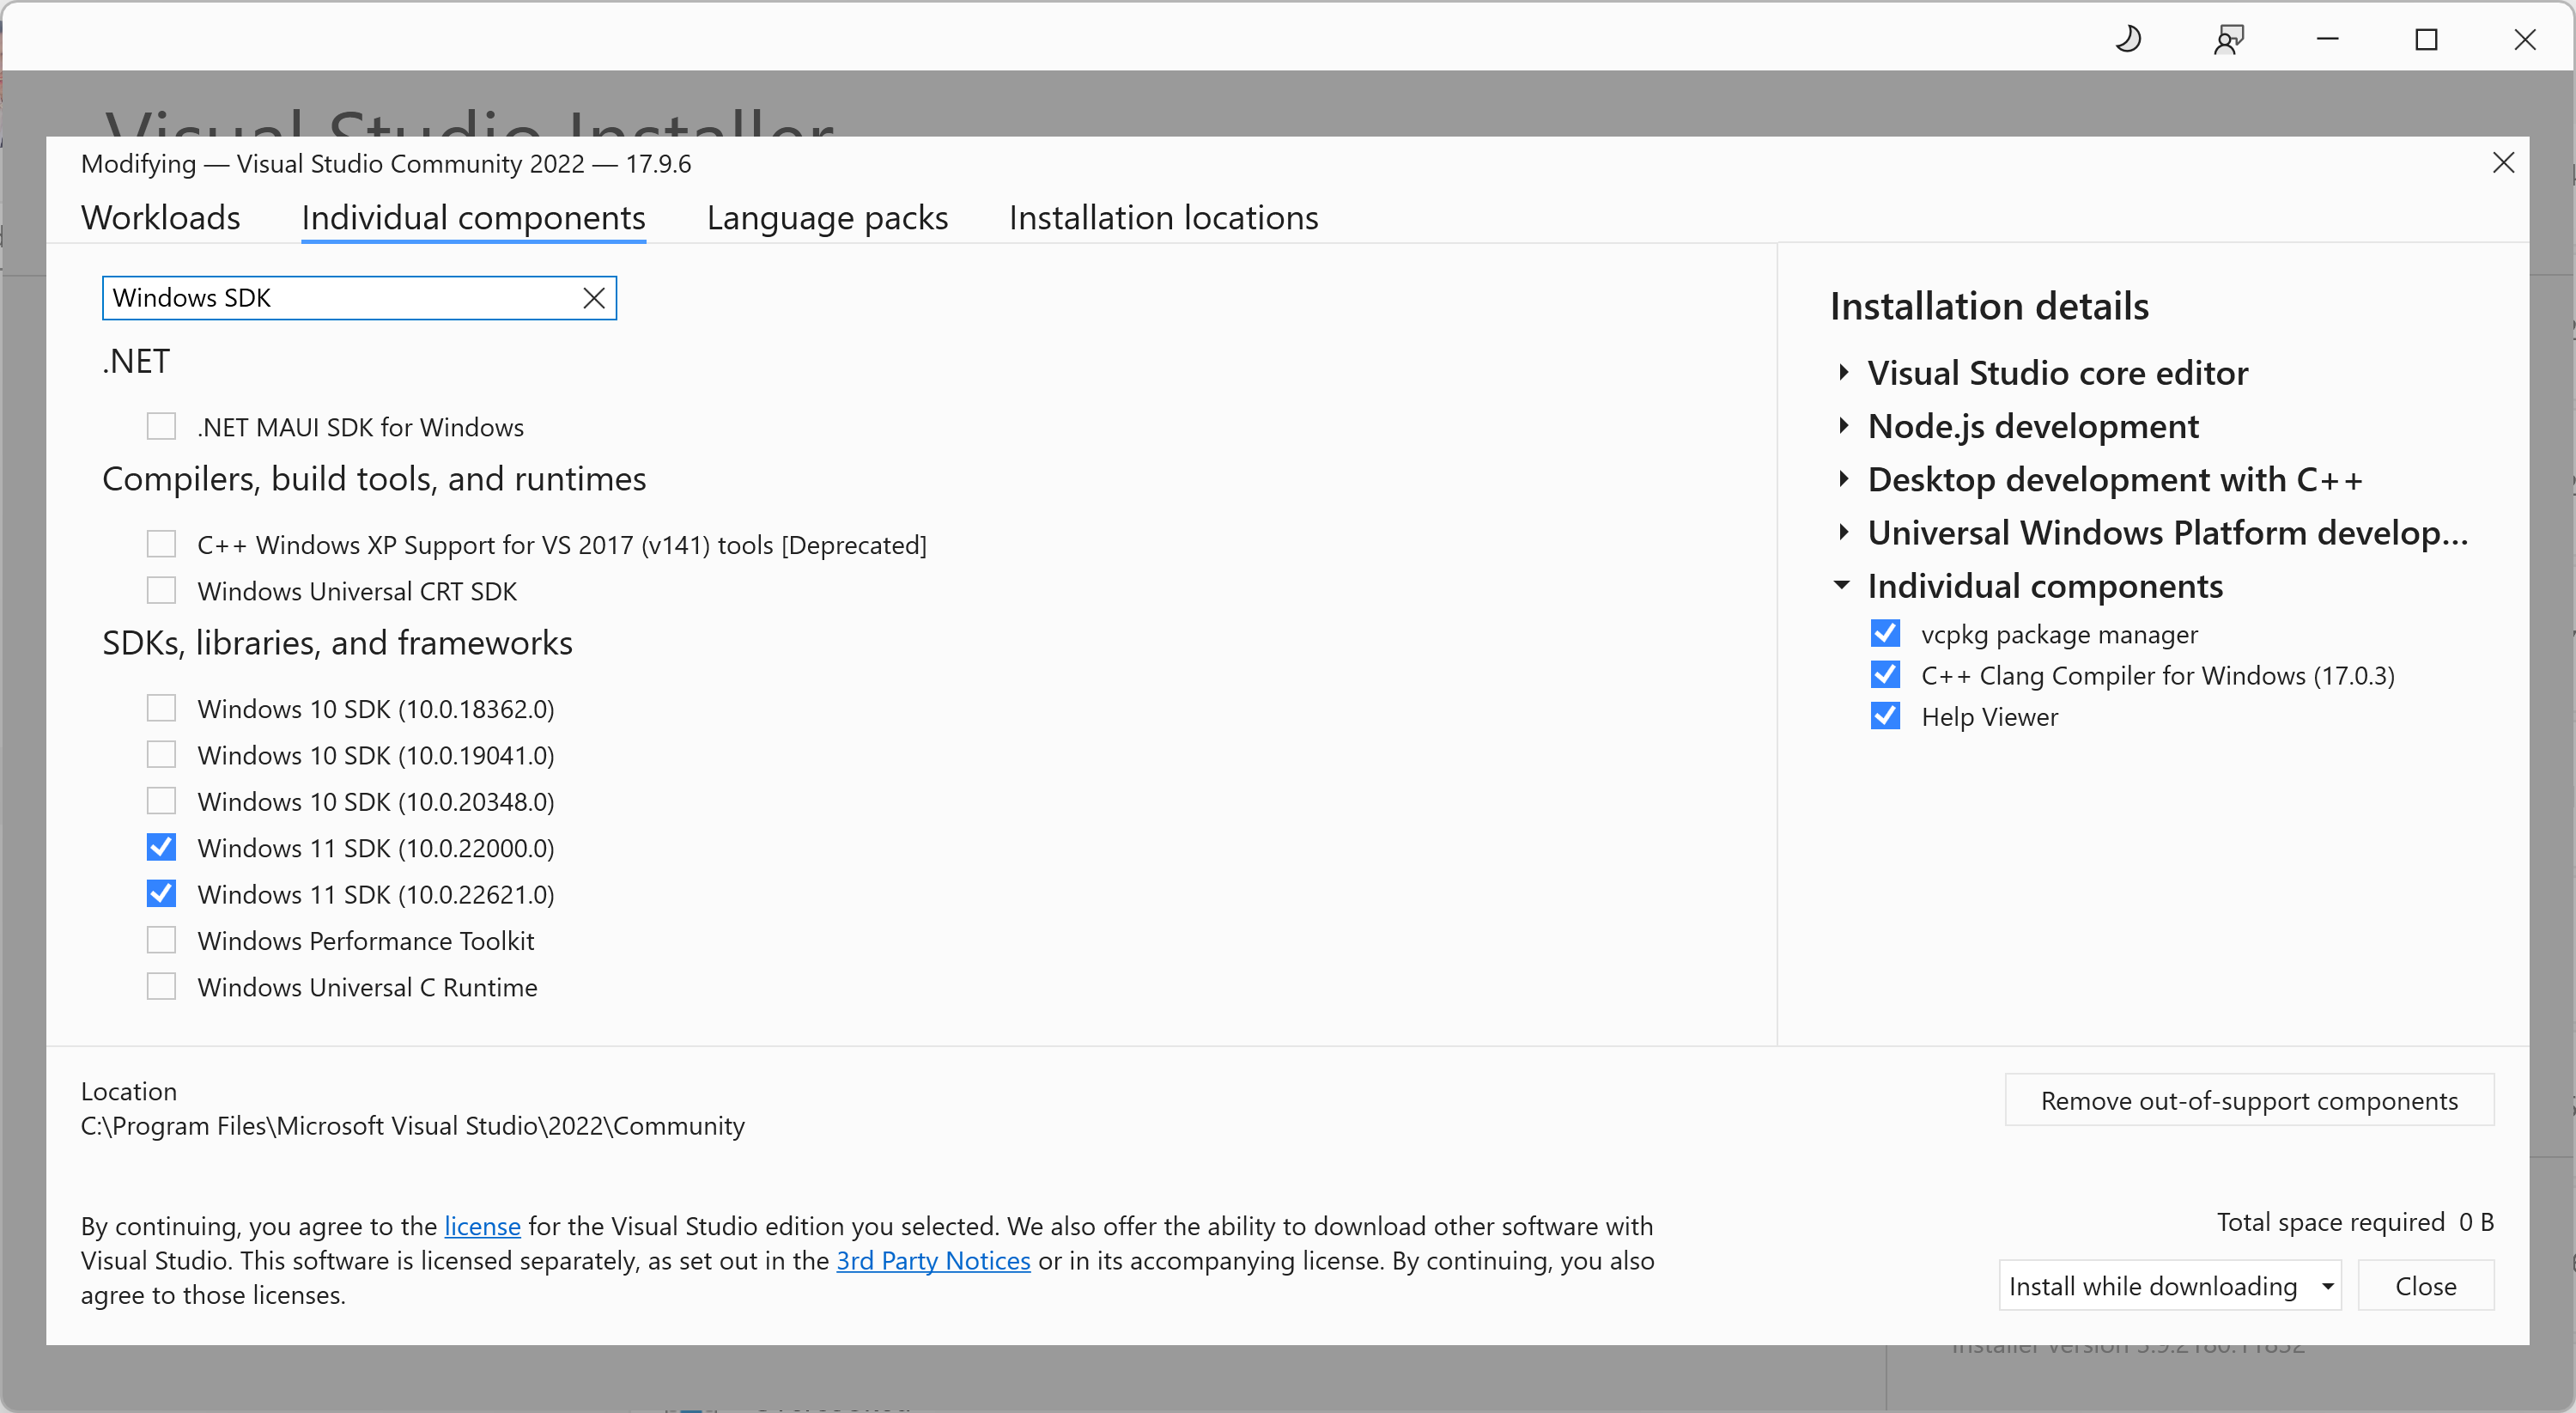
Assuming you are on Windows 11 x64, the Debugging Tools
for Windows suite will install cdb.exe into
the following location:
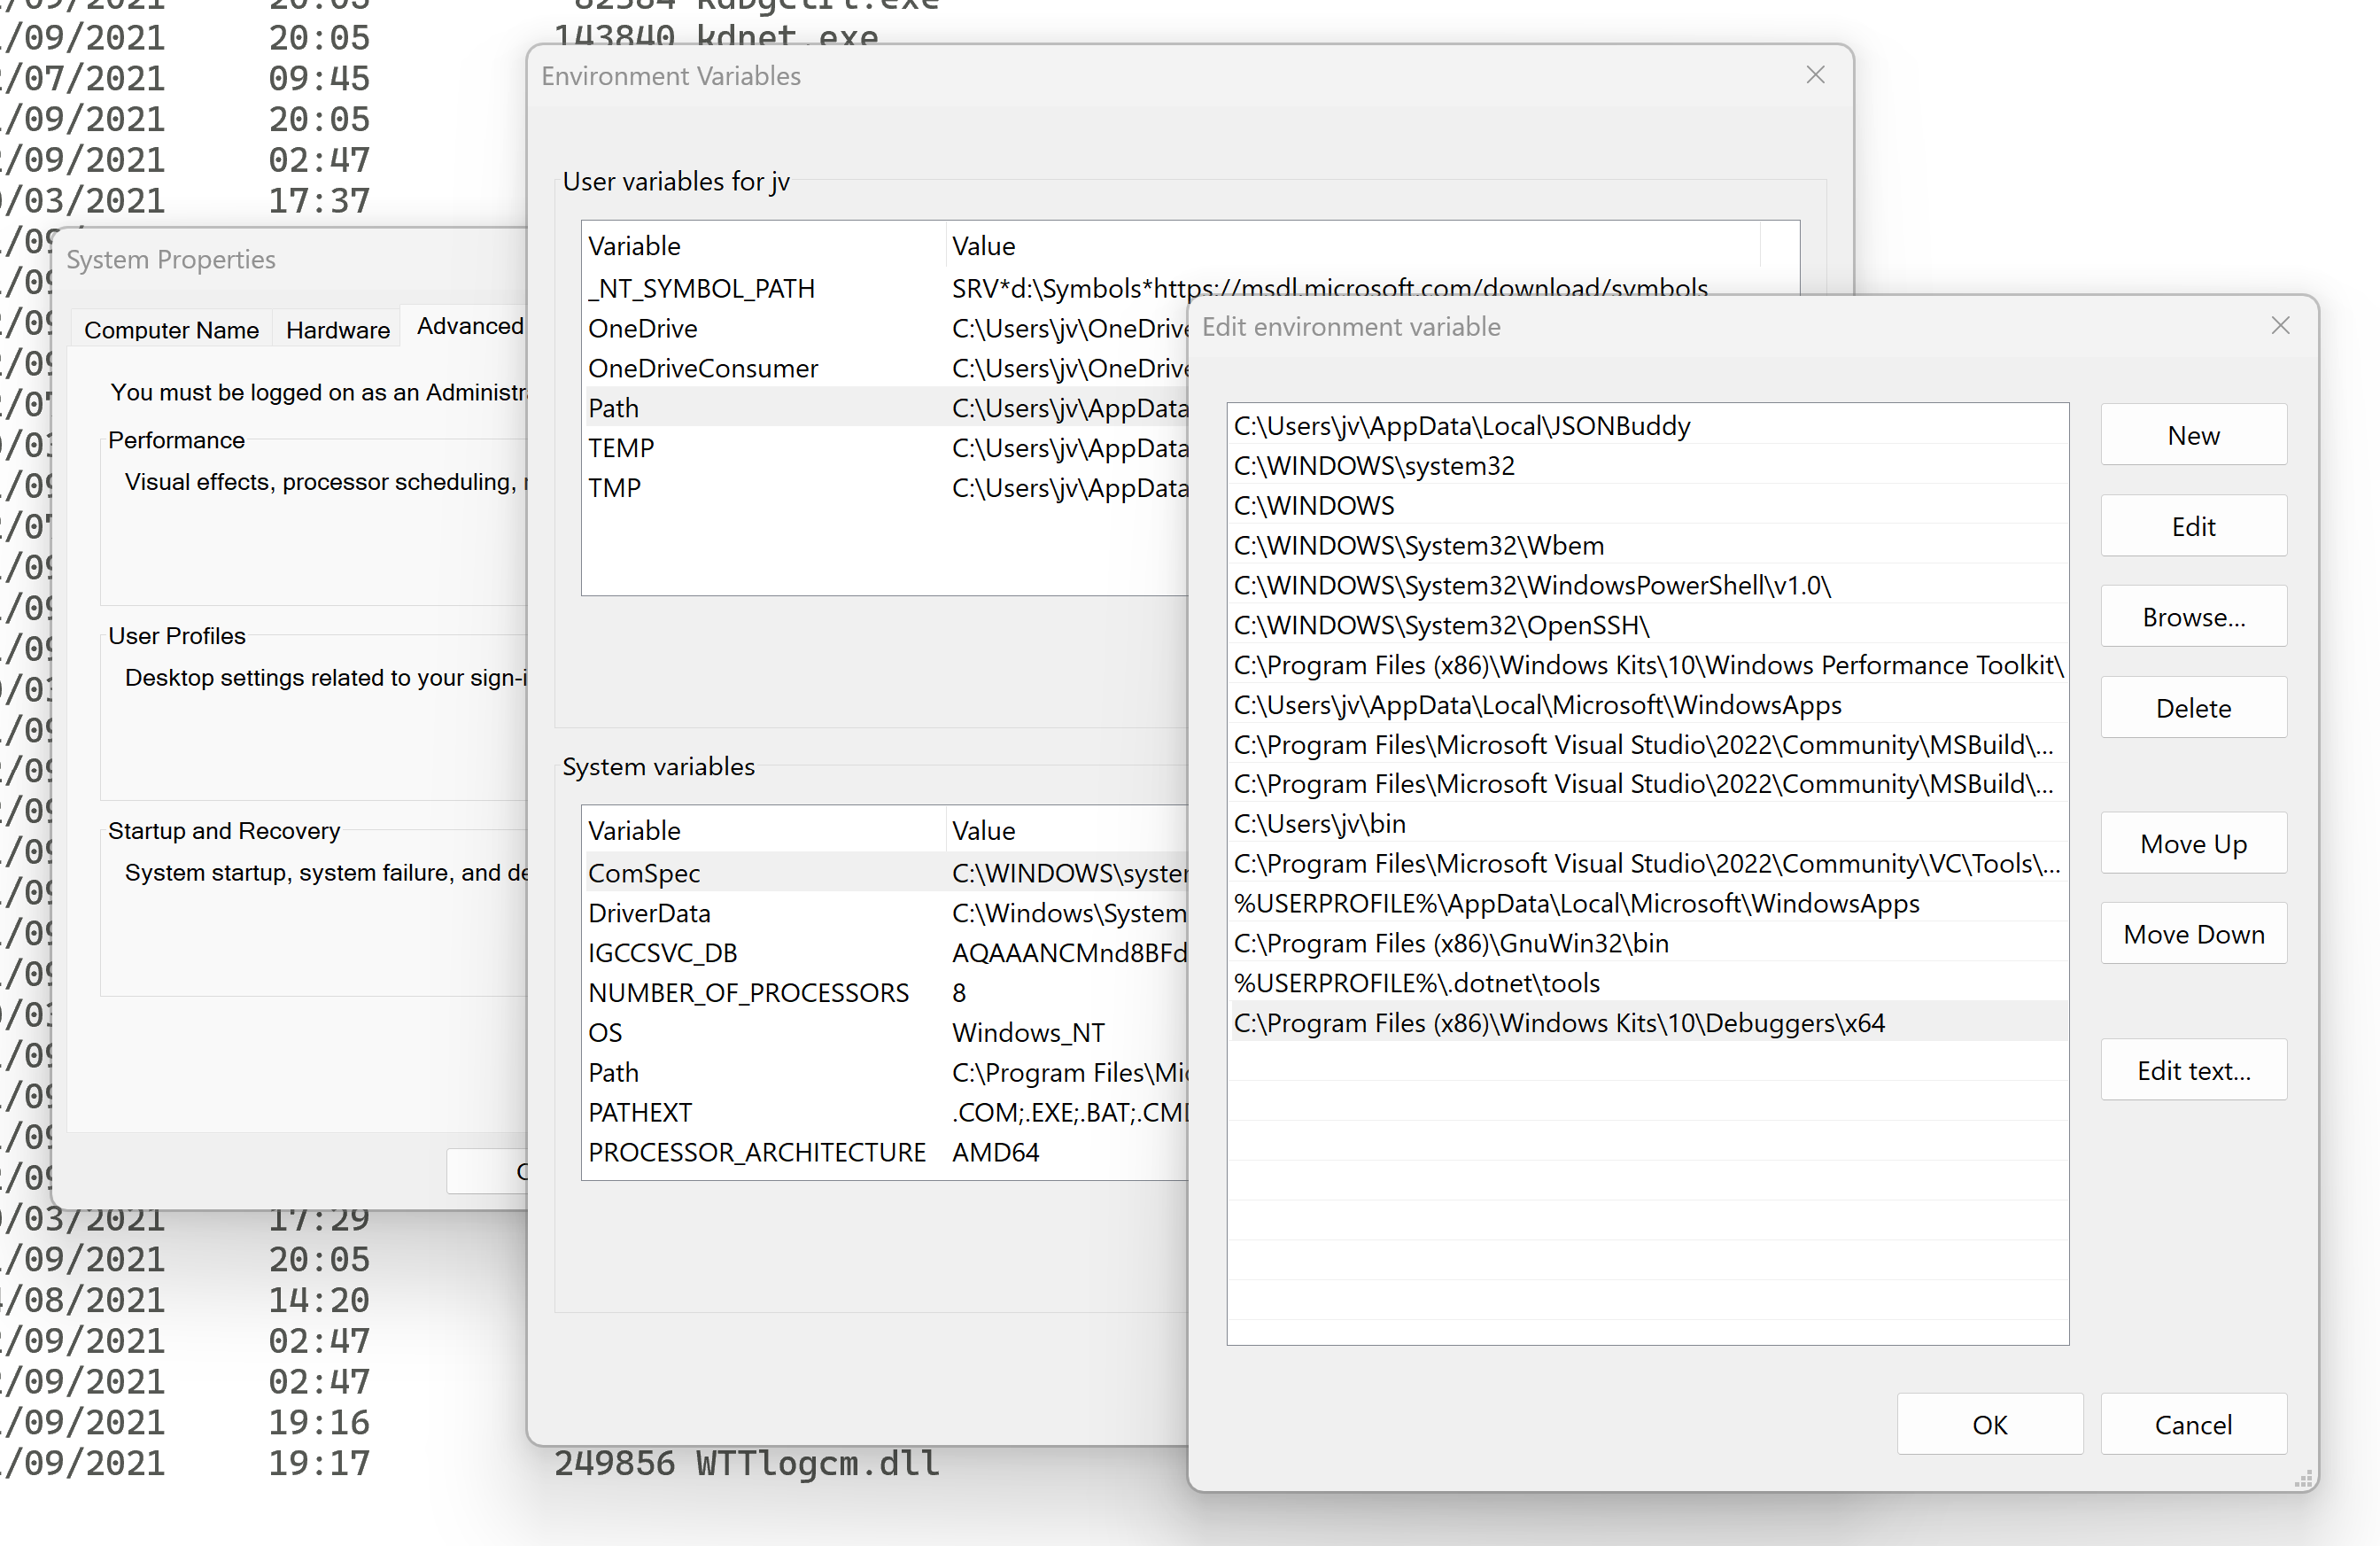
C:\Program Files (x86)\Windows Kits\10\Debuggers\x64\cdb.exeSadly, Visual Studio does not automatically add the previous
directory to the %PATH% on neither the
Developer PowerShell or Developer Command
Prompt. For convenient, you can manually add it to the
executable path through
Settings -> System -> Advanced system settings -> Environment variables....
As a sanity check, you can confirm your CDB installation is ready to go by printing its version as follows:
PS C:\> cdb -version
cdb version 10.0.22000.194
Using CDB
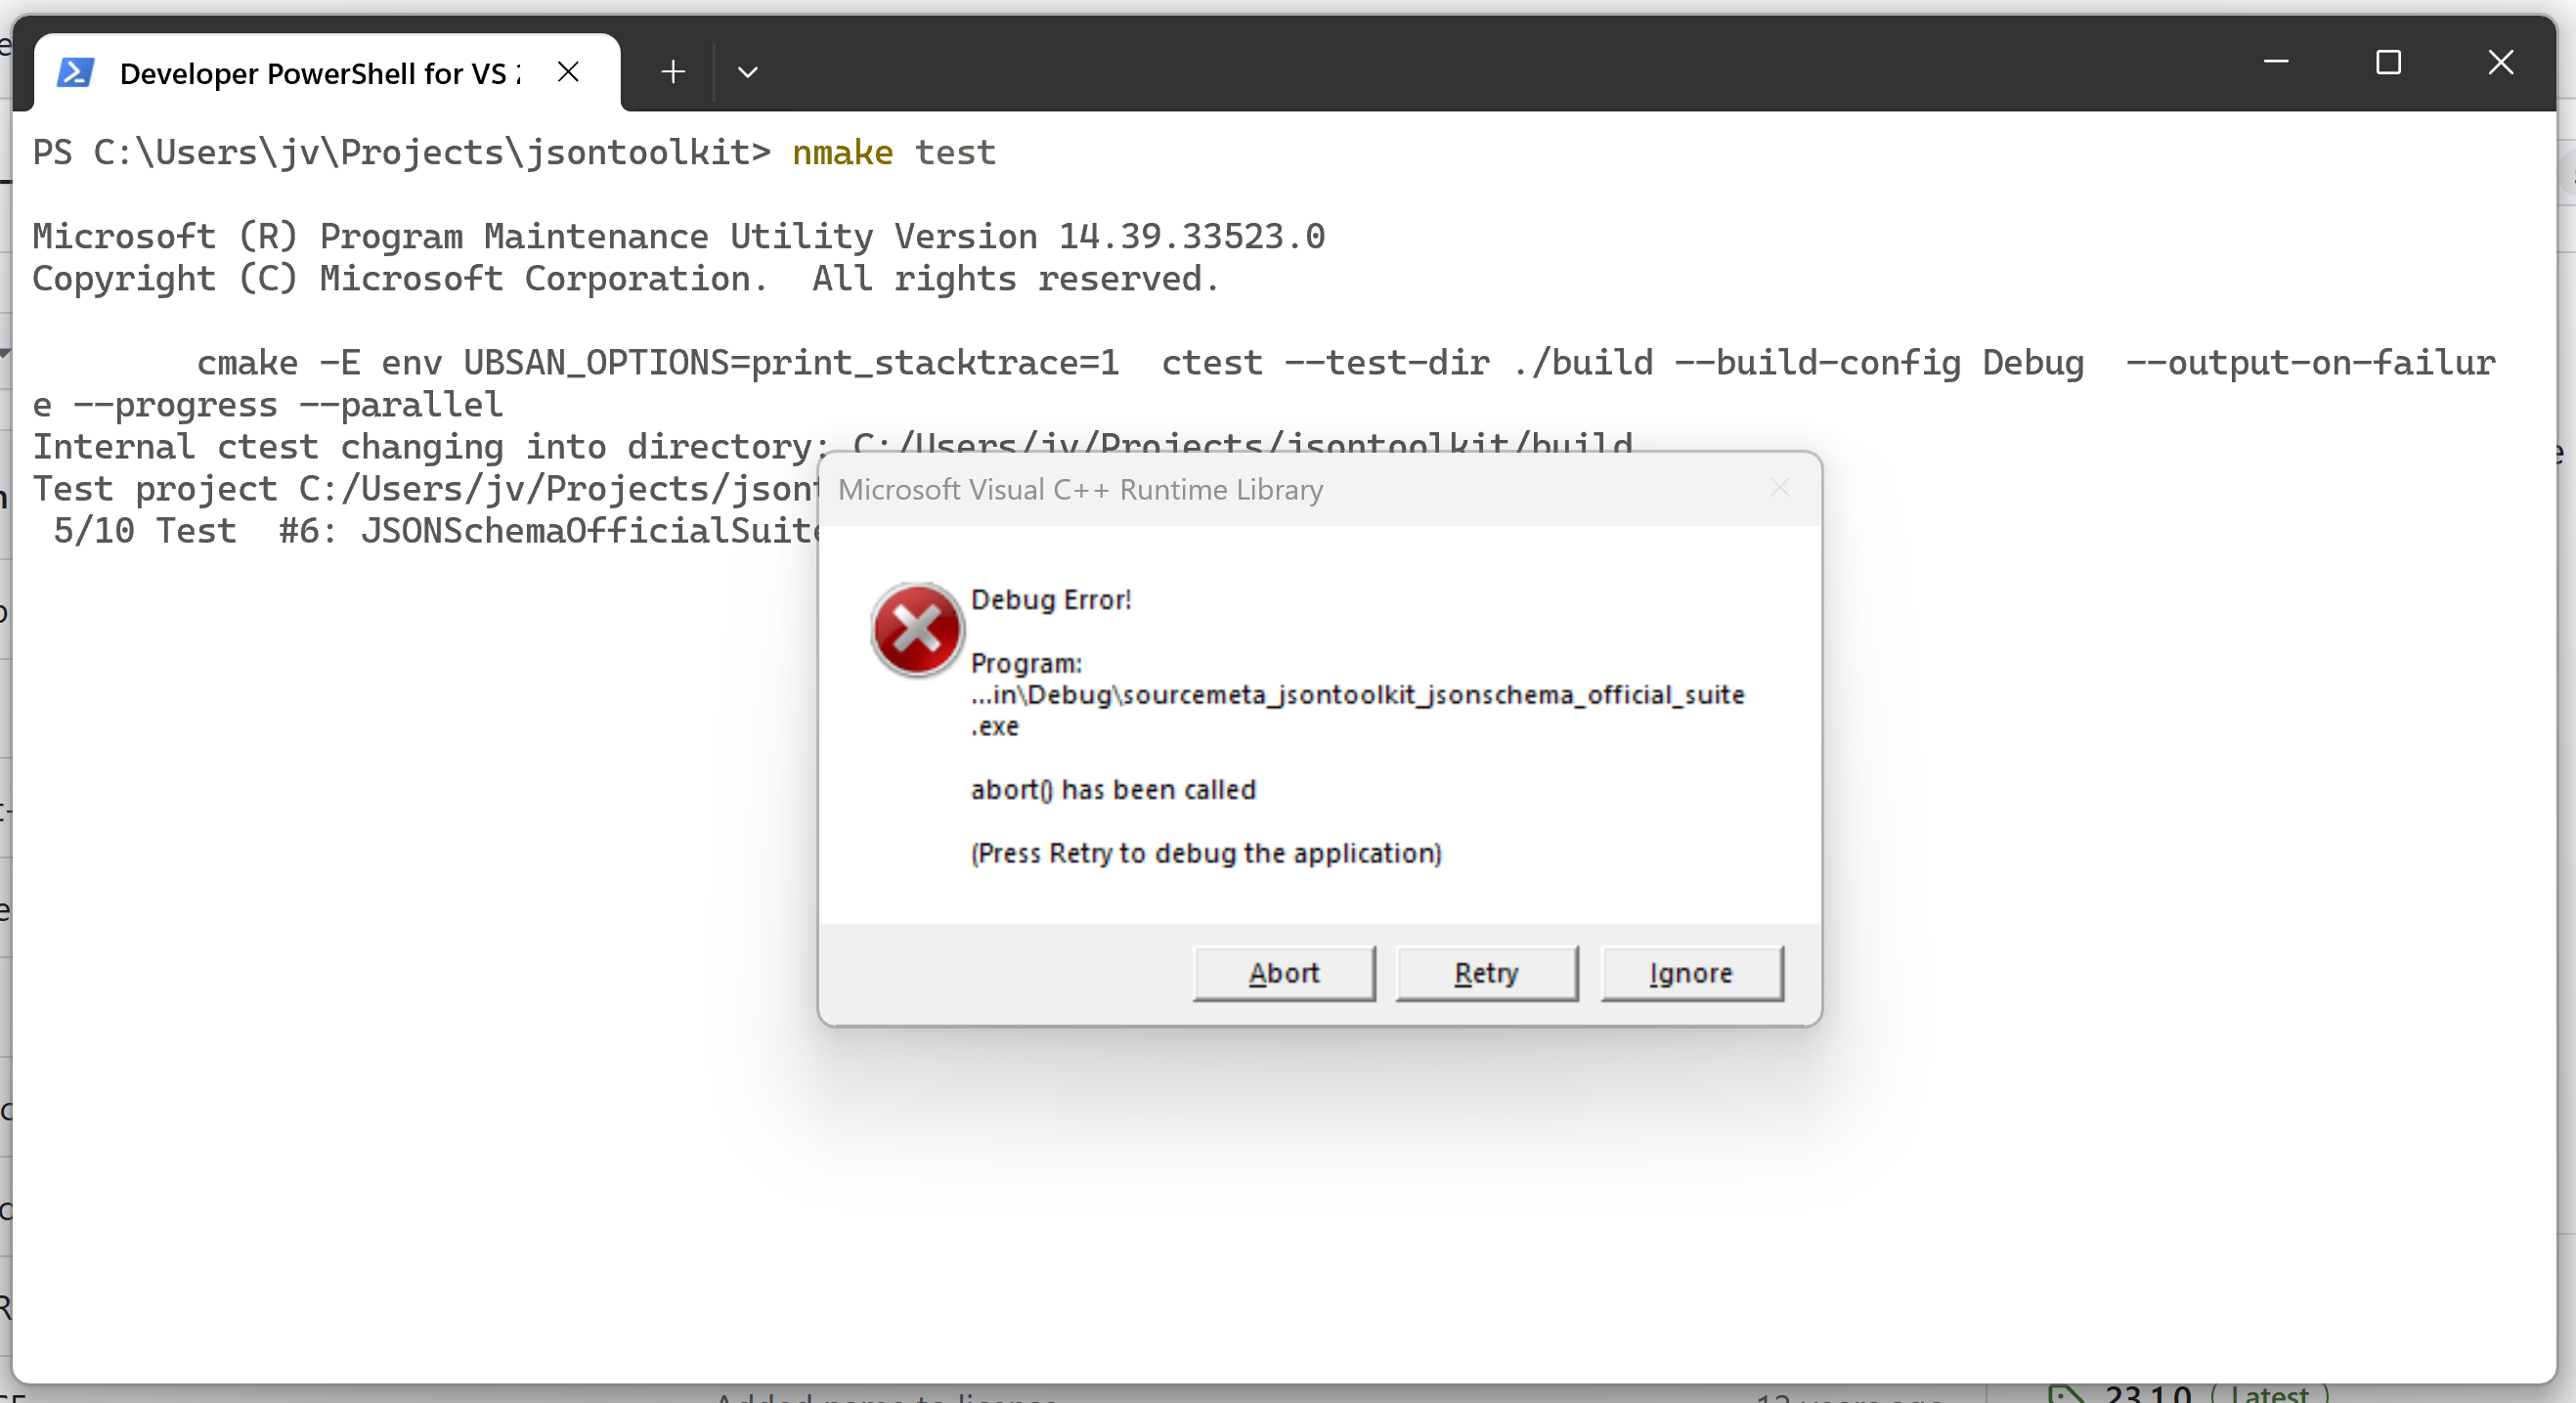
To exemplify CDB, this section will explore a crash I recently saw in JSON Toolkit that only affected MSVC users. The crash originated from one of our unit tests, in which our JSON DOM implementation attempted to parse one of the JSON documents distributed as part of the official JSON Schema Test Suite.
When using CTest
to run this specific test, Windows showed the usual Debug
Error! from the Microsoft Visual C++ Runtime Library as a
result of an uncaught exception, without any further information
about what the exception was or where it came from.
Loading the executable
Like LLDB and GDB, the CDB debugger takes the program
executable as an argument. In my case, the executable that runs
the JSON Schema Test Suite is
sourcemeta_jsontoolkit_jsonschema_official_suite.exe,
so I run CDB from PowerShell as follows:
PS C:\Users\jv\Projects\jsontoolkit> cdb .\build\bin\Debug\sourcemeta_jsontoolkit_jsonschema_official_suite.exe

Microsoft (R) Windows Debugger Version 10.0.22000.194 AMD64
Copyright (c) Microsoft Corporation. All rights reserved.

CommandLine: .\build\bin\Debug\sourcemeta_jsontoolkit_jsonschema_official_suite.exe

************* Path validation summary **************
Response                         Time (ms)     Location
Deferred                                       SRV*d:\Symbols*https://msdl.microsoft.com/download/symbols

************* Path validation summary **************
Response                         Time (ms)     Location
Deferred                                       SRV*d:\Symbols*https://msdl.microsoft.com/download/symbols
Symbol search path is: SRV*d:\Symbols*https://msdl.microsoft.com/download/symbols
Executable search path is:
ModLoad: 00007ff6`157d0000 00007ff6`15af2000   sourcemeta_jsontoolkit_jsonschema_official_suite.exe
ModLoad: 00007ffb`189f0000 00007ffb`18c07000   ntdll.dll
ModLoad: 00007ffb`18280000 00007ffb`18344000   C:\WINDOWS\System32\KERNEL32.DLL
ModLoad: 00007ffb`15d70000 00007ffb`16117000   C:\WINDOWS\System32\KERNELBASE.dll
ModLoad: 00007ffa`ef840000 00007ffa`ef921000   C:\WINDOWS\SYSTEM32\MSVCP140D.dll
ModLoad: 00007ffa`fb9d0000 00007ffa`fb9fe000   C:\WINDOWS\SYSTEM32\VCRUNTIME140D.dll
ModLoad: 00007ffb`15550000 00007ffb`1555f000   C:\WINDOWS\SYSTEM32\VCRUNTIME140_1D.dll
ModLoad: 00007ffa`d4880000 00007ffa`d4aa1000   C:\WINDOWS\SYSTEM32\ucrtbased.dll
ModLoad: 000001de`9b920000 000001de`9bb41000   C:\WINDOWS\SYSTEM32\ucrtbased.dll
ModLoad: 000001de`9bb50000 000001de`9bd71000   C:\WINDOWS\SYSTEM32\ucrtbased.dll
(3e30.16dc): Break instruction exception - code 80000003 (first chance)
ntdll!LdrInitShimEngineDynamic+0x344:
00007ffb`18acbd44 cc              int     3
0:000>
Once the executable is loaded, we will get a prompt to interact the debugger. CDB supports various command-line options that are outside of the scope of this article, so I recommend consulting the CDB Command-Line Options reference documentation to learn more.
Breaking on the uncaught exception
Luckily, CDB automatically breaks on uncaught C++ exceptions.
Therefore, we can resume program execution using the g
(Go) command and we will eventually gain back control right on
the problematic spot:
0:000> g
[... program output ...]
(3e30.16dc): C++ EH exception - code e06d7363 (first chance)
(3e30.16dc): C++ EH exception - code e06d7363 (first chance)
(3e30.16dc): C++ EH exception - code e06d7363 (!!! second chance !!!)
KERNELBASE!RaiseException+0x6c:
00007ffb`15dd543c 0f1f440000      nop     dword ptr [rax+rax]
0:000>
Printing the stack trace
For some reason, when listing frames, CDB defaults to
offset-based instruction locations instead of human-friendly
line numbers. As a consequence, we have to manually toggle
source line support using the .lines
meta-command:
0:000> .lines
Line number information will be loaded
0:000>
With line number support enabled, we can print a stack trace
using the kn
command. This command displays the stack backtrace information
along with its corresponding frame numbers for easy navigation.
In my case, it looks like this:
0:000> kn
 # Child-SP          RetAddr               Call Site
00 00000008`aeafb170 00007ffa`fb9dbbf1     KERNELBASE!RaiseException+0x6c
*** WARNING: Unable to verify checksum for sourcemeta_jsontoolkit_jsonschema_official_suite.exe
01 00000008`aeafb250 00007ff6`159e0df4     VCRUNTIME140D!CxxThrowException+0x131
02 00000008`aeafb2e0 00007ffb`15551080     sourcemeta_jsontoolkit_jsonschema_official_suite!`sourcemeta::jsontoolkit::internal::parse_number_integer<char,std::char_traits<char> >'::`1'::catch$0+0x34 [C:\Users\jv\Projects\jsontoolkit\src\json\parser.h @ 231]
03 00000008`aeafb320 00007ffb`15553aae     VCRUNTIME140_1D+0x1080
04 00000008`aeafb350 00007ffb`18a94246     VCRUNTIME140_1D!_NLG_Return2+0x295e
05 00000008`aeafb420 00007ff6`158be4f6     ntdll!RtlCaptureContext2+0x4a6
06 00000008`aeafdcf0 00007ff6`158bd816     sourcemeta_jsontoolkit_jsonschema_official_suite!sourcemeta::jsontoolkit::internal::parse_number_integer<char,std::char_traits<char> >+0x26 [C:\Users\jv\Projects\jsontoolkit\src\json\parser.h @ 229]
07 00000008`aeafdd50 00007ff6`158bd276     sourcemeta_jsontoolkit_jsonschema_official_suite!sourcemeta::jsontoolkit::internal::parse_number_any_rest<char,std::char_traits<char>,std::allocator>+0x296 [C:\Users\jv\Projects\jsontoolkit\src\json\parser.h @ 516]
08 00000008`aeafde00 00007ff6`158bbbbe     sourcemeta_jsontoolkit_jsonschema_official_suite!sourcemeta::jsontoolkit::internal::parse_number<char,std::char_traits<char>,std::allocator>+0x1b6 [C:\Users\jv\Projects\jsontoolkit\src\json\parser.h @ 579]
09 00000008`aeafdf60 00007ff6`158b4e90     sourcemeta_jsontoolkit_jsonschema_official_suite!sourcemeta::jsontoolkit::parse<char,std::char_traits<char>,std::allocator>+0x176e [C:\Users\jv\Projects\jsontoolkit\src\json\parser.h @ 932]
0a 00000008`aeafe830 00007ff6`158b5119     sourcemeta_jsontoolkit_jsonschema_official_suite!sourcemeta::jsontoolkit::parse+0x70 [C:\Users\jv\Projects\jsontoolkit\src\json\json.cc @ 27]
0b 00000008`aeafe8b0 00007ff6`157f1f2c     sourcemeta_jsontoolkit_jsonschema_official_suite!sourcemeta::jsontoolkit::from_file+0xb9 [C:\Users\jv\Projects\jsontoolkit\src\json\json.cc @ 42]
0c 00000008`aeafea40 00007ff6`157f307c     sourcemeta_jsontoolkit_jsonschema_official_suite!register_tests+0x3ac [C:\Users\jv\Projects\jsontoolkit\test\jsonschema\officialsuite.cc @ 73]
0d 00000008`aeaff4e0 00007ff6`159c2c79     sourcemeta_jsontoolkit_jsonschema_official_suite!main+0x10c [C:\Users\jv\Projects\jsontoolkit\test\jsonschema\officialsuite.cc @ 140]
0e 00000008`aeaff650 00007ff6`159c2b5e     sourcemeta_jsontoolkit_jsonschema_official_suite!invoke_main+0x39 [D:\a\_work\1\s\src\vctools\crt\vcstartup\src\startup\exe_common.inl @ 79]
0f 00000008`aeaff6a0 00007ff6`159c2a1e     sourcemeta_jsontoolkit_jsonschema_official_suite!__scrt_common_main_seh+0x12e [D:\a\_work\1\s\src\vctools\crt\vcstartup\src\startup\exe_common.inl @ 288]
10 00000008`aeaff710 00007ff6`159c2d0e     sourcemeta_jsontoolkit_jsonschema_official_suite!__scrt_common_main+0xe [D:\a\_work\1\s\src\vctools\crt\vcstartup\src\startup\exe_common.inl @ 331]
11 00000008`aeaff740 00007ffb`1829257d     sourcemeta_jsontoolkit_jsonschema_official_suite!mainCRTStartup+0xe [D:\a\_work\1\s\src\vctools\crt\vcstartup\src\startup\exe_main.cpp @ 17]
12 00000008`aeaff770 00007ffb`18a4aa48     KERNEL32!BaseThreadInitThunk+0x1d
13 00000008`aeaff7a0 00000000`00000000     ntdll!RtlUserThreadStart+0x28
0:000>
We can limit the number of frames that kn will
print by passing an integer to it. For example, we can focus on
the point of failure by printing the last 3 frames as
follows:
0:000> kn 3
 # Child-SP          RetAddr               Call Site
00 00000008`aeafb170 00007ffa`fb9dbbf1     KERNELBASE!RaiseException+0x6c
01 00000008`aeafb250 00007ff6`159e0df4     VCRUNTIME140D!CxxThrowException+0x131
02 00000008`aeafb2e0 00007ffb`15551080     sourcemeta_jsontoolkit_jsonschema_official_suite!`sourcemeta::jsontoolkit::internal::parse_number_integer<char,std::char_traits<char> >'::`1'::catch$0+0x34 [C:\Users\jv\Projects\jsontoolkit\src\json\parser.h @ 231]
0:000>
According to this stack trace, the uncaught exception
originates at line 231 of
C:\Users\jv\Projects\jsontoolkit\src\json\parser.h
on a private function called
parse_number_integer.
Exploring source code
While we can easily navigate to the point of failure using a
code editor, we can also explore source code using CDB. To do
so, we need to first select the frame we want to focus on using
the .frame
meta-command. In my case, I will go to frame 2:
0:000> .frame 2
02 00000008`aeafb2e0 00007ffb`15551080     sourcemeta_jsontoolkit_jsonschema_official_suite!`sourcemeta::jsontoolkit::internal::parse_number_integer<char,std::char_traits<char> >'::`1'::catch$0+0x34 [C:\Users\jv\Projects\jsontoolkit\src\json\parser.h @ 231]
0:000>
CDB does not automatically update the current source location
when selecting frames. Instead, we need to manually load it by
copy-pasting its path from the corresponding frame and passing
it to the lsf
command. In my case, the source location is
C:\Users\jv\Projects\jsontoolkit\src\json\parser.h:
0:000> lsf C:\Users\jv\Projects\jsontoolkit\src\json\parser.h
0:000>
According to the stack trace we saw before, the point of
failure is at line 231. To add a bit of context, let’s print 9
lines from the current source location starting at line 225
using the ls
command as follows:
0:000> ls 225, 9
   225: auto parse_number_integer(const std::uint64_t line, const std::uint64_t column,
   226:                           const std::basic_string<CharT, Traits> &string)
   227:     -> std::int64_t {
   228:   try {
   229:     return std::stol(string);
   230:   } catch (const std::out_of_range &) {
   231:     throw ParseError(line, column);
   232:   }
   233: }
0:000>
This snippet shows that the uncaught exception results from
an std::out_of_range
standard exception when executing the std::stol
function.
Printing local variables
The previous snippet reveals that the
parse_number_integer function takes as arguments
information that can more accurately tells at which
point of the JSON file the parser is experiencing the
crash, along with the actual string that the parser is
attempting to interpret as an integer.
In CDB, we can print all local variables in the current frame
using the dv
command:
0:000> dv
           line = 0x4d
         column = 0x19
         string = 0x00000008`aeafdd88 "12391239123"
0:000>
Sadly, CDB always prints integer values in hexadecimal
format, which is not human-friendly for exploring line and
column information. However, we can use the .formats
meta-command to render a number in a wide range of formats. For
example, we can convert the line number
0x4d thatdv` presented like this:
0:000> .formats 0x4d
Evaluate expression:
  Hex:     00000000`0000004d
  Decimal: 77
  Octal:   0000000000000000000115
  Binary:  00000000 00000000 00000000 00000000 00000000 00000000 00000000 01001101
  Chars:   .......M
  Time:    Wed Dec 31 20:01:17 1969
  Float:   low 1.079e-043 high 0
  Double:  3.80431e-322
By looking at the Decimal row, we can tell that
0x4d means line 77.
So far, we know the issue is an
std::out_of_range exception on
std::stol when parsing the integer
12391239123 on line 77 of a given input JSON file.
The JSON Schema Test Suite consists of dozens of JSON files, and
we still don’t know which one we are dealing with.
To answer that, we select the frame that involves the
register_tests helper that calls the sourcemeta::jsontoolkit::from_file
function (which as its name implies, performs a file read):
0:000> .frame 0c
0c 00000008`aeafea40 00007ff6`157f307c     sourcemeta_jsontoolkit_jsonschema_official_suite!register_tests+0x3ac [C:\Users\jv\Projects\jsontoolkit\test\jsonschema\officialsuite.cc @ 73]
0:000>
Running the dv command on that frame reveals the
following key local variables:
0:000> dv
           name = "multipleOf"
...
     suite_name = 0x00000008`aeaff5a8 "JSONSchemaOfficialSuite_Draft4"
default_dialect = 0x00000008`aeaff580 "http://json-schema.org/draft-04/schema#"
...
0:000>
This output tells us that the uncaught exception occurs while
parsing the multipleOf suite for the JSON Schema
Draft 4 tests. The corresponding file is tests/draft4/multipleOf.json.
As expected, line 77 contains our problematic
12391239123 integer:
75   {
76       "description": "any integer is a multiple of 1e-8",
77       "data": 12391239123,
78       "valid": true
79   }
Exitting
Finally, we can end the CDB session using the q
command and return back control to PowerShell:
0:000> q
quit:
PS C:\Users\jv\Projects\jsontoolkit>
Summary
In this article, we covered the basics of the CDB debugger to get a MSVC debugging experience comparable to LLDB and GDB. Like those debuggers, CDB comes with a wide range of advanced commands and meta-commands that we did not touch on. Head over to the official documentation if you wish to learn more: